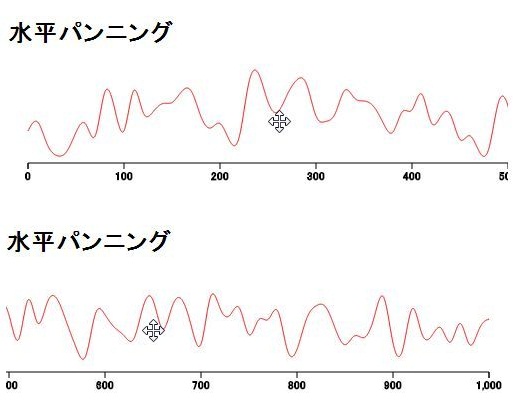
【D3.js】水平パンニング
データを表示する領域を制限して、ドラッグした際に続きのデータを見せる方法。
参考にしたサイトでは、この表示方法を「horizontal panning behavior」と呼んでいたので「水平パンニング」としました。
コードのコメントに書いた以上の説明が出来ないので、詳しく知りたい方は下記のリンク先を参照してください。
サンプル
|
1 2 3 4 5 6 7 8 9 10 11 12 13 14 15 16 17 18 19 20 21 22 23 24 25 26 27 28 29 30 31 32 33 34 35 36 37 38 39 40 41 42 43 44 45 46 47 48 49 50 51 52 53 54 55 56 57 58 59 60 61 62 63 64 65 66 67 68 69 |
//データセットの作成 const dataSet = d3.range(1000).map( (d, i) => { return {x: (i * 10), y: ~~(Math.random()*100)} }) //svg ステージ設置 const width = 980; const maxWisth = width*4; const thresholdWisth = maxWisth - width; const height = 500; const svg = d3.select('body') .append('svg') .attr('width', width) .attr('height', height) .attr('cursor', 'move'); const stage = svg.append("g") //データセットの最大値取得 const xMax = d3.max(dataSet, d => d.x ); //X最大値取得 const yMax = d3.max(dataSet, d => d.y ); //Y最大値取得 const margin = 20; //X軸両端のマージン //スケール関数を作成 const xScale = d3.scaleLinear().domain([0, xMax]).range([margin, maxWisth - margin]); const yScale = d3.scaleLinear().domain([0, yMax]).range([height, 0]); //スケールを元にpathのd属性を設定するline関数を作成 const line = d3.line() .x(d => xScale(d.x) ) .y(d => yScale(d.y) ) .curve(d3.curveBasis) //折れ線グラフ描画 stage.append('g') .datum(dataSet) .append('path') .attr('d', line) .attr('stroke', 'red') .attr('fill', 'none') //X軸補助目盛線描画 const x_axis = d3.axisBottom().scale(xScale); //スケールを元に目盛線を作成 stage.append('g') .attr('class', 'x axis') .attr('transform', `translate(0, ${height-margin})`) .call(x_axis); //ズームイベントリスナーの設定 const zoom = d3.zoom() .on('zoom', function(){ const t = d3.event.transform; //マウスの移動量を取得 let tx = null; //移動範囲を制限 if(t.x <= -thresholdWisth){ //右端の最大移動量を設定 tx = -thresholdWisth; }else if(t.x >= 0){ //左端の最大移動量を設定 tx = 0; }else{ tx = t.x; } //マウスに移動量に合わせてステージを移動 stage.attr('transform', `translate(${tx}, 0)`); }); //ズームイベントリスナーをsvgに設置 svg.call(zoom); |