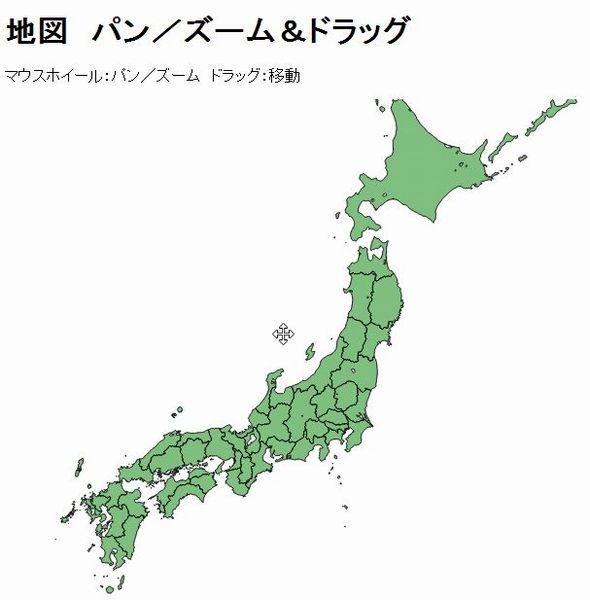
【D3.js】ベクター地図のパン/ズーム&移動
D3.jsで表示した地図のパン/ズーム&移動サンプルです。
サンプル
|
1 2 3 4 5 6 7 8 9 10 11 12 13 14 15 16 17 18 19 20 21 22 23 24 25 26 27 28 29 30 31 32 33 34 35 36 37 38 39 40 41 42 43 44 45 46 47 48 |
d3.json("japan.topojson", function(json) { d3main(json); }); function d3main(json){ var scale = 1500; var geodata = topojson.object(json, json.objects.japan).geometries; projection = d3.geo .mercator() //投影法の指定 .scale(scale) //スケール(ズーム)の指定 .translate([300,350]) .center([139.0032936, 36.3219088]); //中心の座標を指定 var path = d3.geo.path().projection(projection); //投影 var svg = d3.select("svg"); //地図を描画 var map = svg.append("svg:g") .selectAll("path") .data(geodata) .enter() .append("svg:path") .attr({ "d": D(path), "fill": "green", "fill-opacity": 0.5, "stroke": "black" }); //ズームイベント設定 var zoom = d3.behavior.zoom().on('zoom', function(){ projection.scale(scale * d3.event.scale); map.attr('d', path) }); svg.call(zoom); //ドラッグイベント設定 drag = d3.behavior.drag().on('drag', function(){ var tl = projection.translate(); projection.translate([tl[0] + d3.event.dx, tl[1] + d3.event.dy]); map.attr('d', path); }); svg.call(drag); } |