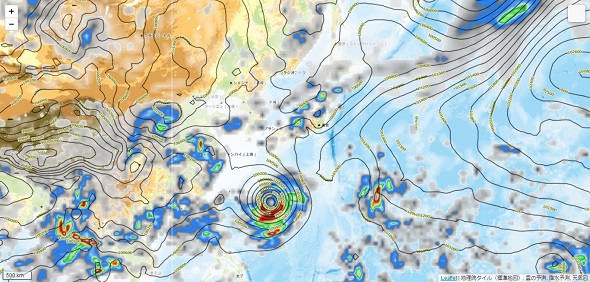
Leaflet.jsで作成した地図上にお天気情報をオーバーレイする
以前、「Google Map上に雲と天気を表示する」という記事を書きましたが、残念なことに「お天気&雲レイヤ」と「Panoramioレイヤ」は2015年に廃止されるそうなので、その代案として「OpenWeatherMap API」を利用してみました。
OpenWeatherMapでは、様々な気象データが取得できるのですが、今回はAPI keyも必要なく簡単に使える画像タイルデータをLeaflet.jsに読み込んで表示しています。
サンプル
OpenWeatherMapから「降水予測」「雲」「気圧図」のタイル画像を読み込み地図上にオーバーレイして表示しています。

|
1 2 3 4 5 6 7 8 9 10 11 12 13 14 15 16 17 18 19 20 21 22 23 24 25 26 27 28 29 30 31 32 33 34 35 36 37 38 39 40 41 42 43 44 45 46 47 48 49 50 51 52 53 54 55 56 57 58 59 60 61 62 63 64 |
//オープンストリートマップレイヤー設定 var osm = L.tileLayer('http://{s}.tile.osm.org/{z}/{x}/{y}.png', { attribution: '© <a href="http://osm.org/copyright">OpenStreetMap</a> contributors' }); //地理院タイル(標準地図)レイヤー設定 var std = new L.tileLayer( 'http://cyberjapandata.gsi.go.jp/xyz/std/{z}/{x}/{y}.png', { attribution: "地理院タイル(標準地図)", }); /********************************************************** * OpenWeatherMap **********************************************************/ var pf = new L.tileLayer( 'http://{s}.tile.openweathermap.org/map/precipitation/{z}/{x}/{y}.png', { attribution: '<a href="">降水予測<a>', opacity:0.8 }); var cf = new L.tileLayer( 'http://{s}.tile.openweathermap.org/map/clouds/{z}/{x}/{y}.png', { attribution: '<a href="">雲の予測</a>', opacity:0.8 }); var pcf = new L.tileLayer( 'http://{s}.tile.openweathermap.org/map/pressure_cntr/{z}/{x}/{y}.png', { attribution: '<a href="">気圧図</a>', opacity:1 }); // OWN end //地図初期化 var map = L.map("map", { center: [37.09, 138.52], zoom: 4, layers: [std,cf,pf,pcf] }); //ベースレイヤーグループ化 var baseMaps = { "Mapbox(osm)": osm, "地理院タイル(標準地図)": std }; //オーバレイヤーグループ化 var overlayMaps = { "雲の予測": cf, "降水予測": pf, "気圧図": pcf, }; //レイヤーコントロール追加 L.control.scale({imperial: false}).addTo(map); L.control.layers(baseMaps, overlayMaps).addTo(map); |