Pathトランジション入門
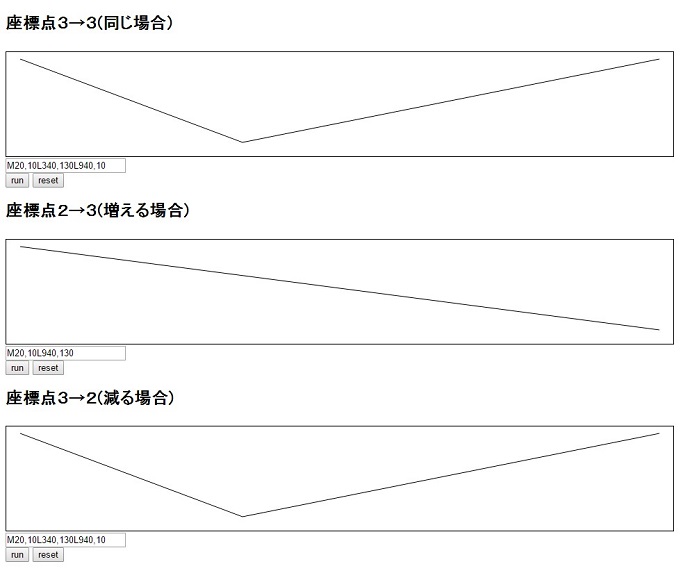
先日からPathのアニメーションをいろいろ試しているわけですが、D3のtransition関数をデータセットを入れ替えてpathに適用した際の動作を確認するためのサンプルを作ったので公開しておきます。
runボタンを押すとそれぞれ、座標点(データセットの数)が同じ場合、増える場合、減る場合の動作を確認できます。
サンプル
|
1 2 3 4 5 6 7 8 9 10 11 12 13 14 15 16 17 18 19 20 21 22 23 24 25 26 27 28 29 30 31 32 33 34 35 36 37 38 39 40 41 42 43 44 45 46 47 48 49 50 51 52 53 54 55 56 57 58 59 60 61 62 63 64 65 66 67 68 69 70 71 72 73 74 75 76 77 78 79 80 81 82 83 84 85 86 87 88 89 90 91 92 93 94 95 96 97 98 99 100 101 102 103 104 105 106 107 108 109 110 111 112 113 114 |
const dataSet1 = [ {x:20, y:10}, {x:940, y:130}, ] const dataSet2 = [ {x:20, y:10}, {x:340, y:130}, {x:940, y:10}, ] const dataSet3 = [ {x:20, y:130}, {x:340, y:10}, {x:940, y:130}, ] const path = d3.line() .x(d => d.x ) .y(d => d.y ) /***************************************************************************** * path 1 頂点3→3(同じ場合) ******************************************************************************/ const svg1 = d3.select("#svg1") const path1 = svg1.append("path") .attr("d", d => { const lineStr = path(dataSet2); document.querySelector("#pahtd1").value = lineStr; return lineStr; }) //実行ボタン d3.select("#run1").on("click", function(){ path1.transition().duration(1000).attr("d", function(){ const lineStr = path(dataSet3); document.querySelector("#pahtd1").value = lineStr; return lineStr; }) }); //リセットボタン d3.select("#reset1").on("click", function(){ path1.attr("d", function(){ const lineStr = path(dataSet2); document.querySelector("#pahtd1").value = lineStr; return lineStr; }) }); /***************************************************************************** * path 2 頂点2→3(増える場合) ******************************************************************************/ const svg2 = d3.select("#svg2") const path2 = svg2.append("path") .attr("d", d => { const lineStr = path(dataSet1); document.querySelector("#pahtd2").value = lineStr; return lineStr; }) d3.select("#run2").on("click", () =>{ path2.transition().duration(1000).attr("d", () => { const lineStr = path(dataSet2); document.querySelector("#pahtd2").value = lineStr; return lineStr; }) }); d3.select("#reset2").on("click", () => { path2.attr("d", () => { const lineStr = path(dataSet1); document.querySelector("#pahtd2").value = lineStr; return lineStr; }) }); /***************************************************************************** * path 3 頂点3→2(減る場合) ******************************************************************************/ const svg3 = d3.select("#svg3") const path3 = svg3.append("path") .attr("d", d => { const lineStr = path(dataSet2); document.querySelector("#pahtd3").value = lineStr; return lineStr; }) d3.select("#run3").on("click", () => { path3.transition().duration(1000).attr("d", () => { const lineStr = path(dataSet1); document.querySelector("#pahtd3").value = lineStr; return lineStr; }) }); d3.select("#reset3").on("click", () => { path3.attr("d", () => { const lineStr = path(dataSet2); document.querySelector("#pahtd3").value = lineStr; return lineStr; }) }); |