【D3.js】 LeafletにSVGをオーバーレイする。
Leafletは、モバイルフレンドリーでインタラクティブな地図をWeb上に表示するJavaScriptライブラリです。最近、海外での存在感が高まっているような気がします。
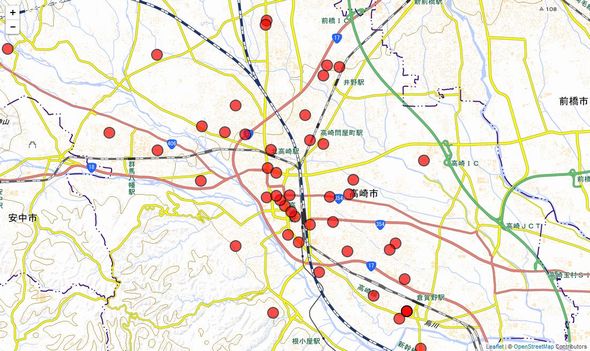
今回は、D3で作成したsvg要素をLeaflet上にオーバーレイしてみました。
(まだ、ソースのコメントに書いたこと以上の知識がないので、サンプルコードのみで詳しい解説はありません)
サンプル
D3.jsとともにLeaflet.jsとleaflet.cssを読み込んでください。
|
1 2 3 4 5 6 7 8 9 10 11 |
<!-- leafletのcssを読み込む --> integrity="sha512-xwE/Az9zrjBIphAcBb3F6JVqxf46+CDLwfLMHloNu6KEQCAWi6HcDUbeOfBIptF7tcCzusKFjFw2yuvEpDL9wQ==" crossorigin="" /> <!-- leafletのスクリプトを読み込む--> <script src="https://unpkg.com/[email protected]/dist/leaflet.js" integrity="sha512-GffPMF3RvMeYyc1LWMHtK8EbPv0iNZ8/oTtHPx9/cc2ILxQ+u905qIwdpULaqDkyBKgOaB57QTMg7ztg8Jm2Og==" crossorigin=""></script> <!-- D3.js ver.5 を読み込む--> |
ポイント情報を表示する
|
1 2 3 4 5 6 7 8 9 10 11 12 13 14 15 16 17 18 19 20 21 22 23 24 25 26 27 28 29 30 31 32 33 34 35 36 37 38 39 40 41 42 43 44 45 46 47 48 |
//Leaflet初期設定 var map = L.map('map').setView([ 36.3219088, 139.0032936 ], 12); var mapLink = '<a target="_blank" href="http://portal.cyberjapan.jp/help/termsofuse.html" rel="noopener noreferrer">国土地理院 地理院地図 標準地図</a>'; //Leafletにsvgレイヤーを追加 L.svg().addTo(map); //Tile Map Serviceの指定 L.tileLayer('http://cyberjapandata.gsi.go.jp/xyz/std/{z}/{x}/{y}.png', { attribution: '© ' + mapLink + ' Contributors', maxZoom: 18 }).addTo(map); // svg要素を選択 var svg = d3.select('#map').select('svg'); //ポイントデータを読み込む d3.json('landprice.geojson').then(function(point) { //元データにLeafletのLatLngobjを追加 point.features.forEach(function(d) { d.LatLngObj = new L.LatLng(d.geometry.coordinates[1], d.geometry.coordinates[0]); }); //サークル要素を追加 var circle = svg .selectAll('circle') .data(point.features) .enter() .append('circle') .attr('stroke', 'black') .attr('stroke-width', 2) .attr('fill', 'red') .attr('fill-opacity', 0.7) .attr('r', 10); var update = function() { //サークル要素の位置をアップデートする console.log('update'); circle.attr('transform', function(d) { return ( 'translate(' + map.latLngToLayerPoint(d.LatLngObj).x + ',' + map.latLngToLayerPoint(d.LatLngObj).y + ')' ); }); }; map.on('moveend', update); update(); }); |
ポリンゴンを表示する
|
1 2 3 4 5 6 7 8 9 10 11 12 13 14 15 16 17 18 19 20 21 22 23 24 25 26 27 28 29 30 31 32 33 34 35 36 37 38 39 40 41 42 43 44 45 46 |
//Leaflet初期設定 var map = L.map('map').setView([ 39.702053, 141.15448379999998 ], 5); var mapLink = '<a target="_blank" href="http://portal.cyberjapan.jp/help/termsofuse.html" rel="noopener noreferrer">国土地理院 地理院地図 標準地図</a>'; //Leafletにsvgレイヤーを追加 L.svg().addTo(map); //Tile Map Serviceの指定 L.tileLayer('http://cyberjapandata.gsi.go.jp/xyz/std/{z}/{x}/{y}.png', { attribution: '© ' + mapLink + ' Contributors', maxZoom: 18 }).addTo(map); d3.json('pref.geojson').then(drawMap); function drawMap(geojson) { // svg要素を選択 var svg = d3.select('#map').select('svg'); var g = svg.append('g'); //緯度経度->パスジェネレーター関数作成 //位置→座標変換 var projectPoint = function(x, y) { var point = map.latLngToLayerPoint(new L.LatLng(y, x)); this.stream.point(point.x, point.y); }; var transform = d3.geoTransform({ point: projectPoint }); var path = d3.geoPath().projection(transform); featureElement = g .selectAll('path') .data(geojson.features) .enter() .append('path') .attr('stroke', 'red') .attr('fill', 'green') .attr('fill-opacity', 0.4); //pathのd属性を更新 var update = function() { featureElement.attr('d', path); }; map.on('moveend', update); update(); } |
参考
D3 + Leaflet Mike Bostock氏によるチュートリアル
関連記事
【D3.js】Google MapにSVGをオーバーレイする(SHAPEデータ軽量化)
【D3.js】OpenLayers上にD3.jsで作成したSVGをオーバーレイ


