【D3.js】Google Map上にボロノイ図を描く
前の記事では、ガソリンスタンドの位置情報を用いて高崎市の地図上にボロノイ図を表示しました。
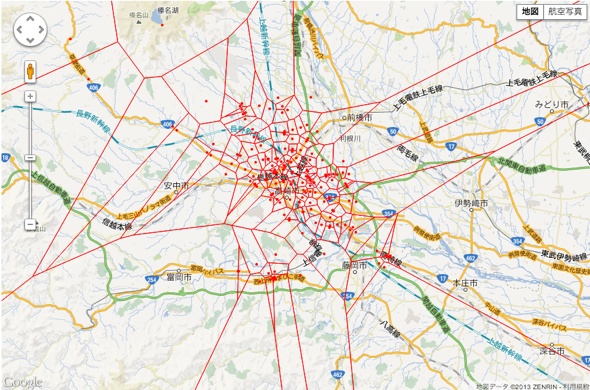
今回は、同じデータを使ってGoogle Map上にボロノイ図を描き、パン/ズームにも対応してみました。
D3.jsを使えば地図上にボロノイ図を書くのも比較的簡単に行えます。
医療機関データなどを使ってボロノイ図を描いてみても面白いかもしれません。
サンプルコード
|
1 2 3 4 5 6 7 8 9 10 11 12 13 14 15 16 17 18 19 20 21 22 23 24 25 26 27 28 29 30 31 32 33 34 35 36 37 38 39 40 41 42 43 44 45 46 47 48 49 50 51 52 53 54 55 56 57 58 59 60 61 62 63 64 65 66 67 68 69 70 71 72 73 74 75 76 77 78 79 80 81 82 83 84 85 86 87 88 |
d3.json('gasStation.geojson', main); function main(pointjson) { //Google Map 初期化 const map = new google.maps.Map(document.getElementById('map'), { zoom: 11, mapTypeId: google.maps.MapTypeId.ROADMAP, center: new google.maps.LatLng(36.322356, 139.013057), }); const overlay = new google.maps.OverlayView(); //OverLayオブジェクトの作成 //オーバレイ追加 overlay.onAdd = function () { const layer = d3.select(this.getPanes().overlayLayer).append("div").attr("class", "SvgOverlay"); const svg = layer.append("svg"); const svgOverlay = svg.append("g").attr("class", "AdminDivisions"); const pointLayer = svgOverlay.append("g"); const voronoiLayer = svgOverlay.append("g"); const markerOverlay = this; const overlayProjection = markerOverlay.getProjection(); //Google Mapの投影法設定 const googleMapProjection = coordinates => { const googleCoordinates = new google.maps.LatLng(coordinates[1], coordinates[0]); const pixelCoordinates = overlayProjection.fromLatLngToDivPixel(googleCoordinates); return [pixelCoordinates.x + 4000, pixelCoordinates.y + 4000]; } //再描画時に呼ばれるコールバック overlay.draw = function () { const width = svg.node().clientWidth; const height = svg.node().clientHeight; //母点位置情報 const pointdata = pointjson.features; //ピクセルポジション情報 const positions = []; pointdata.forEach(d => { positions.push(googleMapProjection(d.geometry.coordinates)); //位置情報→ピクセル }); //母点表示 const updatePoint = pointLayer.selectAll(".point").data(positions) const enterPoint = updatePoint.enter() .append("circle") .attr("class", "point") .attr("r", 2); const point = updatePoint.merge(enterPoint) .attr("transform", d => `translate(${d[0]}, ${d[1]})` ) //ボロノイ変換関数 const voronoi = d3.voronoi() .extent([[-1, -1],[width+1, height+1]]); //ボロノイ境界ポリゴンデータを生成する const polygons = voronoi(positions).polygons(); //境界表示 voronoiLayer.selectAll(".cell").remove(); //一旦全消しして際appendする方がスムーズに地図が動いた。 voronoiLayer.selectAll(".cell").data(polygons) .enter() .append("path") .attr("class", "cell") .attr("fill", "none") .attr("stroke", "black") .attr("d", d => { if(!d) return null return "M" + d.filter( df => df != null ).join("L") + "Z" }) }; }; //作成したSVGを地図にオーバーレイする overlay.setMap(map); }; |