【D3.js】地図上に四分木を描く
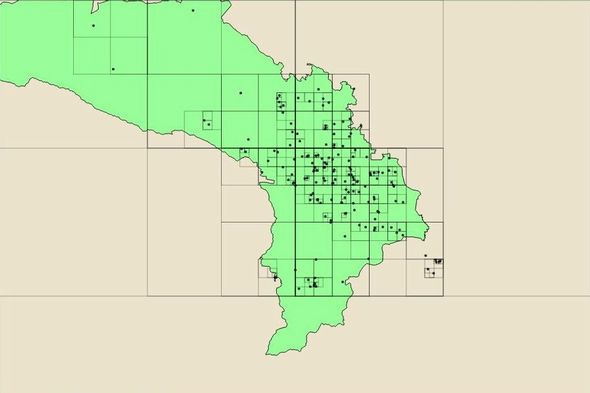
以前、地図上にボロノイ図を描いてみましたが、今回は四分木を描いてみました。
データは前回同様、高崎市のガソリンスタンド位置情報を使用しています。
サンプルコード
|
1 2 3 4 5 6 7 8 9 10 11 12 13 14 15 16 17 18 19 20 21 22 23 24 25 26 27 28 29 30 31 32 33 34 35 36 37 38 39 40 41 42 43 44 45 46 47 48 49 50 51 52 53 54 55 56 57 58 59 60 61 62 63 64 65 66 67 68 69 70 71 72 73 74 75 76 77 78 79 80 81 82 83 84 85 86 87 88 89 |
const width = 980; const height = 500; const svg = d3.select("svg"); const mapLayer = svg.append("g"); const treeLayer = svg.append("g"); const projection = d3.geoMercator(); const path = d3.geoPath(); const q = d3.queue(); q .defer(d3.json, "takasaki.topojson") .defer(d3.json, "gasStation.geojson") .await((error, maps2topo, point2geo) => { const maps2geo = topojson.feature(maps2topo, maps2topo.objects.takasaki); //読み込んだ地図データが描画領域に収まるように自動的にプロジェクションを調整する。 projection.fitExtent([[0,0],[width, height]], maps2geo); path.projection(projection); drawMaps(maps2geo); drawVoronoi(point2geo); }); function drawMaps(geojson){ //地図表示 const map = mapLayer.attr("id", "map") .selectAll("path") .data(geojson.features) .enter() .append("svg:path") .attr("d", path) .attr("fill", "#99ff99") .attr("fill-opacity", 1) .attr("stroke", "black"); } function drawVoronoi(geojson){ const pointdata = geojson.features; const positions = []; pointdata.forEach(d => { positions.push(projection(d.geometry.coordinates)); //位置情報をピクセル座標に変換する }); //母点表示 treeLayer.selectAll(".point") .data(positions) .enter() .append("circle") .attr("class", "point") .attr("transform", d => `translate(${d[0]}, ${d[1]})` ) .attr("r", 2); // 四分木生成 var quadtree = d3.quadtree() .extent([[-1, -1], [width + 1, height + 1]]) .addAll(positions) treeLayer.selectAll(".node") .data(nodes(quadtree)) .enter() .append("rect") .attr("class", "node") .attr("fill", "none") .attr("stroke", "black") .attr("x", function(d) { return d.x0; }) .attr("y", function(d) { return d.y0; }) .attr("width", function(d) { return d.y1 - d.y0; }) .attr("height", function(d) { return d.x1 - d.x0; }); } //rect要素で処理しやすいように、四分木の座標データを配列に変換する function nodes(quadtree) { var nodes = []; quadtree.visit(function(node, x0, y0, x1, y1) { node.x0 = x0, node.y0 = y0; node.x1 = x1, node.y1 = y1; nodes.push(node); }); return nodes; } |
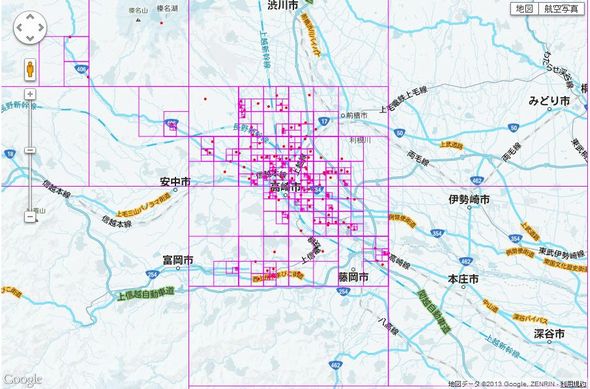
Google Map上でも描いてみた
一応、表示はできましたが拡大していくと四分木の表示がおかしくなります。
原因不明 orz
