【D3.js】 地図上のルートに沿ってアニメーション
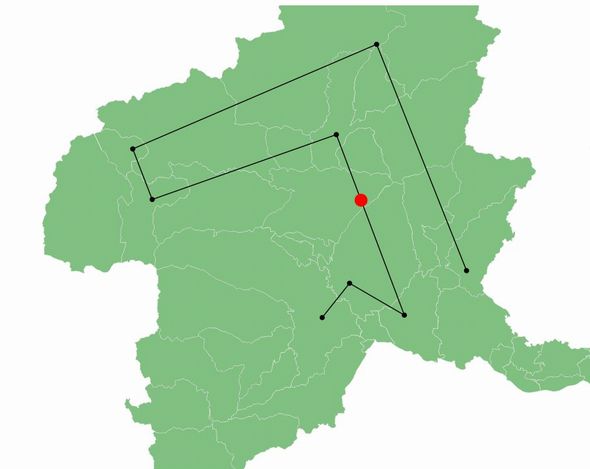
以前の記事で、地図上の2点を結ぶ線を引く方法を掲載しましたが、今回はその引いた線上に沿ってcircleをアニメーションさせるサンプルです。
サンプル
|
1 2 3 4 5 6 7 8 9 10 11 12 13 14 15 16 17 18 19 20 21 22 23 24 25 26 27 28 29 30 31 32 33 34 35 36 37 38 39 40 41 42 43 44 45 46 47 48 49 50 51 52 53 54 55 56 57 58 59 60 61 62 63 64 65 66 67 68 69 70 71 72 73 74 75 76 77 78 79 80 81 82 83 84 85 86 87 88 89 90 91 92 93 94 95 96 97 98 99 100 101 102 103 104 105 106 107 108 109 110 111 |
d3.json("gunma.topojson", function(json) { d3main(json); }); function d3main(json){ var width = 960; var height = 960; var svg = d3.select("svg") .attr("width", width) .attr("height", height); //投影法設定 var projection = d3.geo .mercator() //投影法の指定 .scale(40000) //スケール(ズーム)の指定 .translate([width/2,height/2]) .center([139.0032936, 36.3219088]); //中心の座標を指定 //パスジェネレーター var path = d3.geo.path().projection(projection); //地図追加 var land = svg.insert("path", ".graticule") .datum(topojson.object(json, json.objects.gunma)) .attr({ "class": "land", "d": path, "fill": "green", "opacity": 0.5 }); //境線追加 var boundary = svg.insert("path", ".graticule") .datum(topojson.object(json, json.objects.gunma, function(a, b) { return a !== b; })) .attr({ "class": "boundary", "d": path, "fill": "none", "stroke": "white", "stroke-width": .5 }); //ポイント位置情報 var pointdata = {"type": "LineString", "coordinates": [ [139.013057, 36.322356], //高崎 [139.073177, 36.383191], //前橋 [139.19382500000006, 36.32668100000001], //太田 [139.0441608,36.6460769], //沼田 [138.6388879,36.5314431], //吾妻 [138.59605290000002,36.6207784], //草津 [139.13282479999998,36.8052796], //武尊山 [139.33068750000007,36.4054907] //桐生市 ]} //ポイント間ライン追加 var line = svg.selectAll(".line") .data([pointdata]) .enter() .append("path") .attr({ "class":"line", "d": path, "fill": "none", "stroke": "black", "stroke-width": 1.5 }); //ポイント追加 var point = svg.selectAll(".point") .data(pointdata.coordinates) .enter() .append("circle") .attr({ "cx":function(d) { return projection(d)[0]; }, "cy":function(d) { return projection(d)[1]; }, "r":4, "fill":"black", "fill-opacity":1 }); //path情報取得 var pathNode = d3.selectAll('.line').node(); //ターゲットパス指定 var pathLength = pathNode.getTotalLength(); //アニメーションcircle追加 var circle = svg.append("circle") .attr({ r: 10, fill: 'red', transform: function () { var p = pathNode.getPointAtLength(0) return "translate(" + [p.x, p.y] + ")"; } }); //アニメーション実行 circle.transition() .duration(5000) .ease("linear") .attrTween("transform", function (d, i) { return function (t) { var p = pathNode.getPointAtLength(pathLength*t); return "translate(" + [p.x, p.y] + ")"; } }); } |