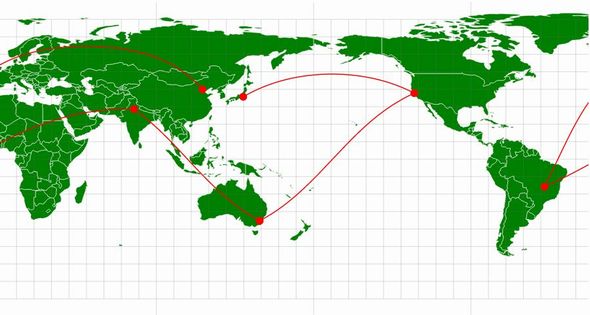
【D3.js】地図上に都市と都市を結ぶ線を引く
都市と都市を結ぶ線を引くサンプルです。
地図をY軸方向に回転などさせてみました。
サンプルコード
基本的には d3.geo.path().projection で作成したパスジェネレーターにgeoJSON形式にした都市の緯度経度を渡してあげれば、あとはいつも通りsvgのpathを使ってラインを生成するだけです。
地図を回転させたりしても各要素のd属性をアップデートするだけで再計算し描画してくれるので便利です。
|
1 2 3 4 5 6 7 8 9 10 11 12 13 14 15 16 17 18 19 20 21 22 23 24 25 26 27 28 29 30 31 32 33 34 35 36 37 38 39 40 41 42 43 44 45 46 47 48 49 50 51 52 53 54 55 56 57 58 59 60 61 62 63 64 65 66 67 68 69 70 71 72 73 74 75 76 77 78 79 80 81 82 83 84 85 86 87 88 89 90 91 92 93 94 95 96 97 98 99 100 101 102 103 104 105 106 107 108 109 110 111 112 113 114 |
d3.json("conuntries.topojson", function(json) { d3main(json); }); function d3main(json){ var width = 960; var height = 480; var svg = d3.select("svg") .attr("width", width) .attr("height", height); //投影法設定 var projection = d3.geo.equirectangular() .scale(153) .translate([width / 2, height / 2]) .rotate([-180,0,0]) .precision(.1); //パスジェネレーター var path = d3.geo.path().projection(projection); //グリッド情報ジェネレーター var graticule = d3.geo.graticule(); //グリッド線追加 var grid = svg.append("path") .datum(graticule) .attr({ "class": "graticule", "d": path, "fill": "none", "stroke": "#777", "stroke-width": ".5px", "stroke-opacity": .5 }); //国土追加 var land = svg.insert("path", ".graticule") .datum(topojson.object(json, json.objects.conuntries)) .attr({ "class": "land", "d": path, "fill": "green" }); //国境線追加 var boundary = svg.insert("path", ".graticule") .datum(topojson.object(json, json.objects.conuntries, function(a, b) { return a !== b; })) .attr({ "class": "boundary", "d": path, "fill": "none", "stroke": "white", "stroke-width": .5 }); //都市 位置情報 var pointdata = {"type": "LineString", "coordinates": [ [139.69170639999993, 35.6894875], //東京 [-122.41941550000001, 37.7749295], //サンフランシスコ [149.1242241, -35.30823549999999], //キャンベラ [77.22496000000001, 28.635308], //ニューデリー [-47.92916980000001, -15.7801482], //ブラジリア [116.40752599999996, 39.90403], //北京 ]} //都市間ライン追加 var line = svg.selectAll(".line") .data([pointdata]) .enter() .append("path") .attr({ "class":"line", "d": path, "fill": "none", "stroke": "red", "stroke-width": 1.5 }); //都市ポイント追加 var point = svg.selectAll(".point") .data(pointdata.coordinates) .enter() .append("circle") .attr({ "cx":function(d) { return projection(d)[0]; }, "cy":function(d) { return projection(d)[1]; }, "r":6, "fill":"red", "fill-opacity":1 }); /***Y軸回転させる***************************************/ rotateY=0; setInterval(function(){ //projection 更新 rotateY++; if (rotateY >= 360) rotateY=0 projection.rotate([-180,rotateY,0]); //各要素を更新 grid.attr("d", path); land.attr("d", path); boundary.attr("d", path); line.attr("d", path); point.attr({ "cx":function(d) { return projection(d)[0]; }, "cy":function(d) { return projection(d)[1]; }, }) },100); } |