[Turf.js]ヘックス(六角形)で統計情報を地図上に視覚化する
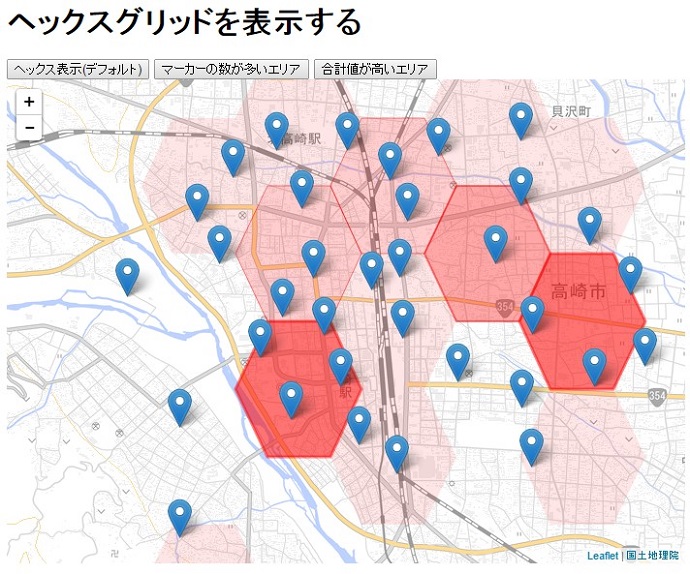
表示されている範囲内にヘックス(六角形)を敷き詰め、各セルに含まれるマーカーの数やマーカーに設定されたvalue値の合計数で可視化しています。サンプルとしてセルのサイズを大きめに設定(1km)していますが、100m位までならそこそこ問題なく動きます。
それより小さいサイズのセルを表示したい場合は、nodeを使ってバックエンドで計算してから出力した方がよさそうです。
サンプル
|
1 2 3 4 5 6 7 8 9 10 11 12 13 14 15 16 17 18 19 20 21 22 23 24 25 26 27 28 29 30 31 32 33 34 35 36 37 38 39 40 41 42 43 44 45 46 47 48 49 50 51 52 53 54 55 56 57 58 59 60 61 62 63 64 65 66 67 68 69 70 71 72 73 74 75 76 77 78 79 80 81 82 83 84 85 86 87 88 89 90 91 92 93 94 95 96 97 98 99 100 101 102 103 104 105 106 107 108 109 110 111 112 113 114 115 116 117 118 119 120 121 122 123 124 125 126 127 128 129 130 131 132 133 134 135 136 137 138 139 140 141 142 143 |
fetch('../_dataset/sample.geojson') .then(function(response) { return response.json() }).then(function(json) { draw(json) }); function draw(points){ //取得する統計情報(合計値、個数) var aggregations = [ { aggregation: 'sum', inField: 'value', outField: 'pt_sum' }, { aggregation: 'count', inField: '', outField: 'pt_count' } ]; map = L.map('map').setView([36.3265281, 139.00918460000003], 14); //地理院地図レイヤー追加 L.tileLayer( 'http://cyberjapandata.gsi.go.jp/xyz/pale/{z}/{x}/{y}.png', { attribution: "<a href='http://www.gsi.go.jp/kikakuchousei/kikakuchousei40182.html' target='_blank'>国土地理院</a>" } ).addTo(map); //マーカークリック時にポップアップを表示 var onEachFeature = function(feature, layer) { var popupContent = "value:"; if (feature.properties && feature.properties.value) { popupContent += feature.properties.value; } layer.bindPopup(popupContent); } //マーカーを地図に追加 var markerLayer = L.geoJson(points, { onEachFeature: onEachFeature }).addTo(map); //ヘックスグリッド用のレイヤーを準備 var hexLayer = L.geoJson().addTo(map); //表示されている四隅の緯度経度を取得 var b = map.getBounds(); extend = [b.getSouthWest().lng , b.getSouthWest().lat , b.getNorthEast().lng, b.getNorthEast().lat] //表示されている範囲をヘックスで埋める var grid = turf.hexGrid(extend, 1, "kilometers"); //ヘックスデータに統計情報を付加(各セルにおけるマーカーの数とvalueの合計値) var grid = turf.aggregate(grid, points, aggregations); //各セルのスタイルを設定 grid.features.forEach(setStyle); //ヘックスグリッドを地図に追加 hexLayer.addData(grid); /* * event lestener */ document.querySelector("#non").addEventListener("click",function(){ hexLayer.eachLayer(function(l) { l.setStyle(l.feature.properties.withNon); //ヘックスのみ表示 }); }); document.querySelector("#sum").addEventListener("click",function(){ hexLayer.eachLayer(function(l) { l.setStyle(l.feature.properties.withSum); //合計値を視覚化 }); }); document.querySelector("#count").addEventListener("click",function(){ console.log("click"); hexLayer.eachLayer(function(l) { l.setStyle(l.feature.properties.withCount); //マーカーの数を視覚化 }); }); //初期スタイルを実行 document.querySelector("#non").dispatchEvent(new Event('click')) } //各セルのスタイルを指定 function setStyle(cell){ cell.properties.withNon = {}; cell.properties.withCount = {}; cell.properties.withSum= {}; var _widthNon = {}; _widthNon.color = '#0000FF'; _widthNon.weight = 1; _widthNon.fill = '#0000FF'; _widthNon.fillOpacity = 0.1; cell.properties.withNon = _widthNon; var pt_count = cell.properties.pt_count; var pt_sum = cell.properties.pt_sum; var _withCount = {}; _withCount.color = '#00FF00'; _withCount.weight = 0; _withCount.fill = '#00FF00'; _withCount.fillOpacity = 0; if(pt_count >= 1) { _withCount.fillOpacity = 0.1; } if(pt_count >= 2) { _withCount.fillOpacity = 0.2; _withCount.weight = 1; } if(pt_count >= 3) { _withCount.weight = 2; _withCount.fillOpacity = 0.35; } if(pt_count >= 4) { _withCount.weight = 3; _withCount.fillOpacity = 0.55; } cell.properties.withCount = _withCount; var _withSum = {}; _withSum.color = '#FF0000'; _withSum.weight = 0; _withSum.fill = '#FF0000'; _withSum.fillOpacity = 0; if(pt_sum >= 50) { _withSum.fillOpacity = 0.1; } if(pt_sum >= 100) { _withSum.fillOpacity = 0.2; _withSum.weight = 1; } if(pt_sum >= 150) { _withSum.weight = 2; _withSum.fillOpacity = 0.35; } if(pt_sum >= 200) { _withSum.weight = 3; _withSum.fillOpacity = 0.55; } cell.properties.withSum = _withSum; } |