【D3.js】グラフと地図を連動させる
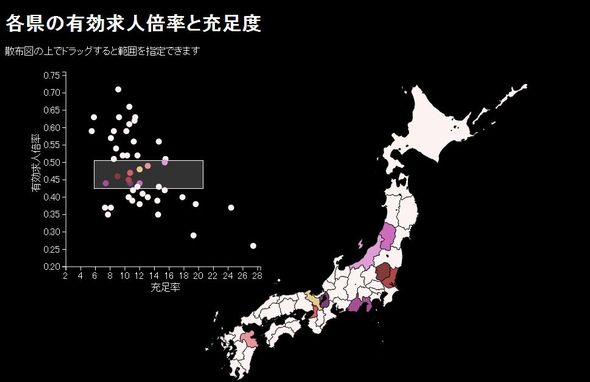
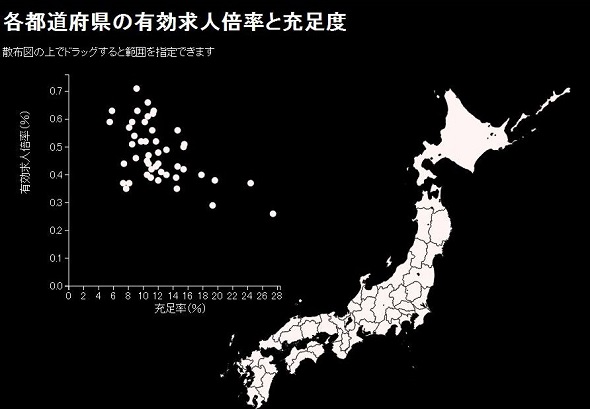
散布図上でドラッグすると、選択した範囲の都道府県に色が付きます。

d3.svg.brushを使って、散布図と地図を連動させるサンプルを作成しました。
データセットの作成
有効求人倍率と充足率の情報は「社会生活統計指標」より。
都道府県の地図データは以下よりいただきました。
都道府県色塗り用shapeファイル(英語表記)
社会生活統計指標からダウンロードした「労働」統計表をExcel上で編集してcsvに。
作成したcsvと都道府県色塗り用shapeファイルをQuantum GISに読み込み結合。(結合の方法は以下を)
属性データにCSVまたはDBFファイルを結合したい
結合したデータをgeojsonで出力し、さらにtopojsonに変換します。
topojsonへの変換は「TopoJSONを使う」を参照してください。
出来上がったデータセットは以下。
todofuken.topojson
サンプルコード
|
1 2 3 4 5 6 7 8 9 10 11 12 13 14 15 16 17 18 19 20 21 22 23 24 25 26 27 28 29 30 31 32 33 34 35 36 37 38 39 40 41 42 43 44 45 46 47 48 49 50 51 52 53 54 55 56 57 58 59 60 61 62 63 64 65 66 67 68 69 70 71 72 73 74 75 76 77 78 79 80 81 82 83 84 85 86 87 88 89 90 91 92 93 94 95 96 97 98 99 100 101 102 103 104 105 106 107 108 109 110 111 112 113 114 115 116 117 118 119 120 121 122 123 124 125 126 127 128 129 130 131 132 133 134 135 136 137 138 139 140 141 142 143 144 145 146 147 148 149 150 151 152 153 154 155 156 157 158 159 160 161 162 163 164 165 166 167 168 169 170 171 172 173 174 175 |
d3.json("todofuken.topojson", function(json) { d3main(json); }); function d3main(json){ var plotsize = 320; //散布図の縦横サイズ var baseColor = "#fef4f4"; //地図、circleのベースカラー //塗り分けカラーの設定 var colorList = ["#ce6dbd", "#f7b6d2", "#8ca252", "#ff7f0e", "#de9ed6", "#d62728", "#e377c2", "#e7ba52", "#2ca02c", "#e377c2", "#f7b6d2", "#c7c7c7", "#ffbb78", "#e7cb94", "#dbdb8d", "#8c564b", "#b5cf6b", "#843c39", "#7b4173", "#aec7e8", "#ffbb78", "#8c564b", "#bd9e39", "#dbdb8d", "#c5b0d5", "#7f7f7f", "#9edae5", "#c49c94", "#c49c94", "#393b79", "#9467bd", "#5254a3", "#a55194", "#637939", "#17becf", "#cedb9c", "#1f77b4", "#1f77b4", "#9467bd", "#ff9896", "#ff7f0e", "#9c9ede", "#ad494a", "#ff9896", "#98df8a", "#17becf", "#7f7f7f", "#bcbd22", "#98df8a", "#bcbd22", "#c5b0d5", "#2ca02c", "#8c6d31", "#aec7e8", "#6b6ecf", "#d6616b", "#e7969c", "#c7c7c7", "#d62728", "#9edae5"]; //カラースケール var colorScale = d3.scale.ordinal().domain([1,47]).range(colorList); //dataSetの準備 var geodata = topojson.object(json, json.objects.todofuken).geometries; //topojosnデータ //var geodata = json.features; //geojsonを使う場合はこちら //データセットの型変換 geodata.forEach(function(d) { d.properties.jobs_ratio = parseFloat(d.properties.jobs_ratio); d.properties.fullness_rate = parseFloat(d.properties.fullness_rate); }); //有効求人倍率の最大値取得 var jobs_ratioMax = d3.max(geodata, function(d){ return d.properties.jobs_ratio; }); //充足率の最大値取得 var fullness_rateMax = d3.max(geodata, function(d){ return d.properties.fullness_rate; }); //scale関数(正規化)生成 var xScale = d3.scale.linear().domain([0, fullness_rateMax+1]).range([0, plotsize]); var yScale = d3.scale.linear().domain([jobs_ratioMax+0.05, 0]).range([0, plotsize]); //axis関数(目盛り)の生成 var xAxis = d3.svg.axis().scale(xScale).orient('bottom'); var yAxis = d3.svg.axis().scale(yScale).orient('left'); //地図投影法設定 var projection = d3.geo .mercator() //投影法の指定 .scale(1500) //スケール(ズーム)の指定 .translate([600,350]) //表示位置調整 x,y .center([139.0032936, 36.3219088]); //中心の座標を指定 //geoデータ→svg path変換関数生成 var path = d3.geo.path().projection(projection); //表示ステージ var svg = d3.select("svg"); //mapを作成するグループ var mapGroup = svg.select('#map'); //map表示 var map = mapGroup.append("svg:g") .selectAll("path") .data(geodata) .enter() .append("svg:path") .attr('class', function(d){ return d.properties.ObjName } ) .attr({ "d": function(d){ return path(d)}, "fill": baseColor, "fill-opacity": 1, "stroke": "black" }) .on('mouseover', function(){ d3.selectAll( "."+d3.select(this).attr('class') ) //マウスオーバーしたエリアと同じclass名の要素を選択 .attr("fill", "red"); }) .on('mouseout', function(){ d3.selectAll( "."+d3.select(this).attr('class') ) .attr("fill", baseColor); //バグあり あとで直す }); //散布図を作成するグループ var plotGroup = svg.select('#plot').attr("transform", "translate(" + [100, 10] + ")"); /* *circleより下のレイヤーにbrushを表示したいので先に作成する *circleの上にbrushを表示すると、ツールチップを表示するイベントが取得できなくなるため。 */ //brashイベントのコールバック var brushed = function() { var select = brush.extent(); var rightBotom = select[0]; var leftTop = select[1]; circle.attr("fill", fillFnc); map.attr("fill",fillFnc); //選択範囲内を色塗り function fillFnc(d,i){ if( d.properties.fullness_rate > rightBotom[0] && d.properties.jobs_ratio > rightBotom[1] && d.properties.fullness_rate < leftTop[0] && d.properties.jobs_ratio < leftTop[1] ) return colorScale(d.properties.jis); return baseColor; } } var brush = d3.svg.brush() //brushオブジェクト作成 .x(xScale) //x軸を選択可能範囲に指定 .y(yScale) .on("brush", brushed); var brushFGroup = plotGroup.append("g") //brushグループを作成 .attr("class", "brush") .call(brush) //brushオブジェクトをグループに適用 .selectAll("rect") //circleを作成するグループ var circlegroup = plotGroup.append('g'); //circle表示 var circle = circlegroup.selectAll('circle') .data(geodata) .enter() .append('circle') .attr('class', function(d){ return "tipsy " + d.properties.ObjName } ) .attr({ r:5, cx:function(d){ return xScale( d.properties.fullness_rate )}, cy:function(d){ return yScale( d.properties.jobs_ratio )}, fill: baseColor }) //ツールチップを表示するためtitle要素を追加 var tooltip = circle.append('title').text(function(d){ return d.properties.pref}); //x目盛軸表示 var xAxisLine = plotGroup.append("g") .attr("class", "x axis") .attr("transform", "translate(0," + plotsize + ")") .call(xAxis); //x目盛軸タイトル表示 var xAxisTitle = xAxisLine.append('text') .attr({ y:40, x:Math.floor(plotsize/2)-30 }) .text('充足率(%)') //y目盛軸 var yAxisLine = plotGroup.append("g") .attr("class", "y axis") .attr("transform", "translate(0," + 0 + ")") .call(yAxis); //y目盛軸タイトル表示 var yAxisTitle = yAxisLine.append('text') .attr({ "transform":'rotate(-90 -60, 0) translate(-240)' }) .text('有効求人倍率(%)') } |
“【D3.js】グラフと地図を連動させる” への1件の返信
現在コメントは受け付けていません。