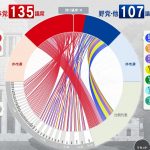
【D3.js】NHKの参議院選挙サイトで使用されていた謎グラフ(Chord graph)的なものを作ってみる。

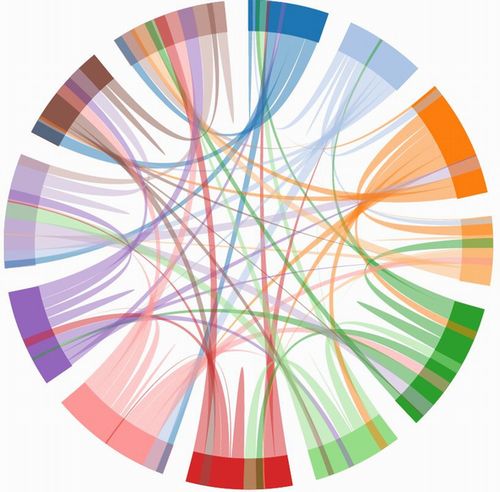
上記のような図を「Chord graph(コードグラフ)」というらしいです。日本語に直すと弦グラフですかね?D3.jsにはChordレイアウトが用意されているので作成するのは比較的簡単です。頑張ればNHKの参議院選挙サイトで使われていたカッコイイ!グラフも作れるかもしれません。
サンプルコード
|
1 2 3 4 5 6 7 8 9 10 11 12 13 14 15 16 17 18 19 20 21 22 23 24 25 26 27 28 29 30 31 32 33 34 35 36 37 38 39 40 41 42 43 44 45 46 47 48 49 50 51 52 53 54 55 |
var svg = d3.select("svg") //データセットの作成 dataLength = 12; var data = d3.range(dataLength).map(function() { return d3.range(dataLength).map(function(){ return Math.floor(Math.random() *dataLength) }) }); //console.log(data); //カラースケール var color = d3.scale.category20(); //chordジェネレータ生成 var chord = d3.layout.chord() .padding(0.1)//データ束間の隙間 .matrix(data); //chord全体 var chordGroup = svg.append('g') .attr("transform", "translate("+[400, 400]+")" ); //外円 chordGroup.selectAll("path.groups") .data(chord.groups) .enter() .append("path") .attr({ "fill": function(d) { return color(d.index); }, "stroke": function(d) { return color(d.index); }, "d": d3.svg.arc().innerRadius(350).outerRadius(400), }); //データ間のリンク chordGroup.selectAll("path.chord") .data(chord.chords) .enter() .append("path") .attr({ "fill": function(d) { return color(d.source.index); }, "d": d3.svg.chord().radius(400), "opacity": 0.5 }) .on('mouseover', function(){ d3.select(this).attr({ 'fill': "red", "opacity": 1 }); }) .on('mouseout', function(){ d3.select(this).attr({ 'fill': function(d) { return color(d.source.index); }, "opacity": 0.5 }); }); |
「データの関連性や相関関係を表すのに適した図」らしいのですが……ぶっちゃけこのレイアウトってそんなに見やすくはないと思うんですよねー。
目的を頭に置き続けましょう。それが試金石となり、導きの光となります。円形のレイアウトという誘惑の言葉や、追加データの誘惑に、「できるのだから」とささやく偽預言者に惑わされそうになったら、目的を思い出しましょう。これらは旅の障害です。
デザイニング・データビジュアライゼーション
