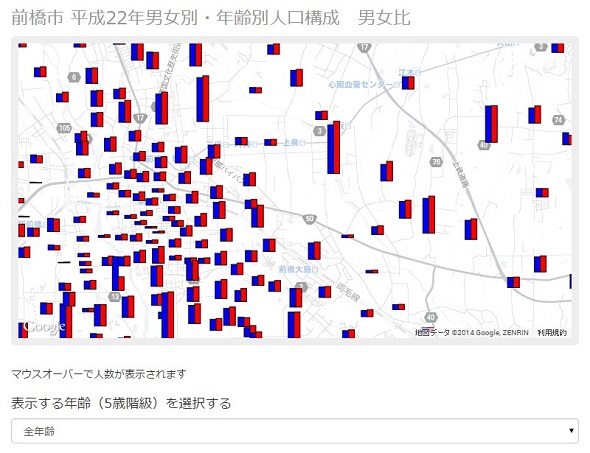
【D3.js】Google Map上に棒グラフを表示する
円グラフに引き続き、棒グラフを地図上に表示してみました。
棒グラフは高さのスケールを設定するのが難しいですね。
サンプル
今回も、Google Maps APIのdrawメソッド内だけ参考に載せます。
|
1 2 3 4 5 6 7 8 9 10 11 12 13 14 15 16 17 18 19 20 21 22 23 24 25 26 27 28 29 30 31 32 33 34 35 36 37 38 39 40 41 42 43 44 45 46 47 48 49 50 51 52 53 54 55 56 57 58 59 60 61 62 63 64 65 66 67 68 69 70 |
overlay.draw = function () { var index = getIndex(); //選択されている項目を取得 //ピクセルポジション情報 pointdata.forEach(function(d) { var point = googleMapProjection([d['X_CODE'] ,d['Y_CODE']]);//位置情報→ピクセル d['xpoint'] = point[0]; d['ypoint'] = point[1]; }); //最大値取得 var max = d3.max(pointdata, function(d){ if (+d['女の総数'] > +d['男の総数']) { return +d['女の総数'] }else{ return +d['男の総数'] } }); //棒グラフの高さスケールを設定 var barH = 100; var barW = 8; var yScale = d3.scale.linear().domain([0, max]).range([0, barH]); //前のグラフをすべて削除する d3.selectAll(".bar").remove() //データの数だけ棒グラフを書く pointdata.forEach(function(point){ if (+point['男'+index] <= 0 && +point['女'+index] <= 0) return ; //男女ともに0人の場合は抜ける //棒グラフ作成用のデータセットを作る var data = [ {key:"男", value:point['男'+index], city:point.CITYNAME, town:point.NAME}, {key:"女", value:point['女'+index], city:point.CITYNAME, town:point.NAME} ]; //棒グラフグループ var barGroup = gunmalayer //Gmap上のsvgレイヤ .append("g") .attr("class", "bar") .attr("transform", "translate(" + point.xpoint+ "," + point.ypoint + ")") //円グラフを表示する座標を指定 //棒グラフ描画 var bar = barGroup.selectAll("rect") .data(data) .enter() .append("rect") .attr({ x:function(d,i){ return i * barW - (barW/2) }, y:function(d){ return barH - yScale(d.value) }, width:barW, height:function(d){ return yScale(d.value) }, stroke:"black", fill:function(d, i){ if (i == 0) { return "blue"; }else{ return "red"; } } }); //マウスオーバーした際に詳細を表示 bar.append("title") .text(function(d){ return d.town + " " + d.key + ":" +d.value + "人" }) }); }; |
D3.jsを使てGoogle Map上にSVGを表示する方法は以下を参照してください。
【D3.js】Google MapにSVGをオーバーレイする(SHAPEデータ軽量化)