前橋市一次避難場所
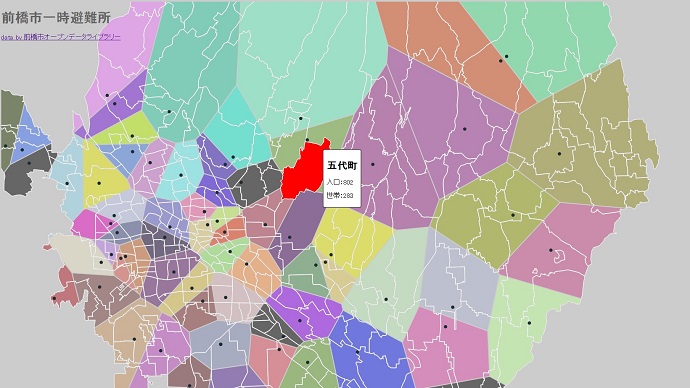
「前橋市オープンデータライブラリー」から取得した町界データと一次避難場所データをD3を使って視覚化してみました。
一次避難場所の位置を母点としたボロノイ図を描き、町界データでマスクをかけています。
ボロノイ領域の塗り分けカラーはランダム。
各セル(ボロノイ領域)が母点となる一次避難場所のおおよその担当領域みたいな感じになるわけですが、北の方はだいぶ避難所まで遠いですね。
この地域で災害が発生した場合の手筈がどうなっているのかは後で調べてみたいとおもます。
サンプル
マウスホイールでパン/ズームが、ドラッグで移動できます。
町境にマウスオーバーするとエリアを強調(赤)した上でツールチップで人口と世帯数を表示。母点(一次避難場所)にマウスオーバーするとボロノイ領域の協調(赤)と避難場所の名称と住所を表示します。
|
1 2 3 4 5 6 7 8 9 10 11 12 13 14 15 16 17 18 19 20 21 22 23 24 25 26 27 28 29 30 31 32 33 34 35 36 37 38 39 40 41 42 43 44 45 46 47 48 49 50 51 52 53 54 55 56 57 58 59 60 61 62 63 64 65 66 67 68 69 70 71 72 73 74 75 76 77 78 79 80 81 82 83 84 85 86 87 88 89 90 91 92 93 94 95 96 97 98 99 100 101 102 103 104 105 106 107 108 109 110 111 112 113 114 115 116 117 118 119 120 121 122 123 124 125 126 127 128 129 130 131 132 133 134 135 136 137 138 139 140 141 142 143 144 145 146 147 148 149 150 151 152 153 154 155 156 157 158 159 160 161 162 163 164 165 166 167 168 169 170 171 172 173 174 175 176 177 178 179 180 181 |
d3.json("maebashi_light.geojson", function(maebashi) { d3.json('refuge.geojson', function(refuge){ draw(maebashi, refuge); }); }); function draw(maebashi,refuge){ var geodata = maebashi.features; //前橋町境地理データ var pointdata = refuge.features; //避難所ポイントデータ var positions = []; var colorGen= function(){ //カラージェネレーター return '#'+Math.floor(Math.random()*16777215).toString(16); } //ツールチップ要素追加 var tooltip = d3.select("body") .append("div") .attr("class", "tooltip") .style("position", "absolute") .style("z-index", "10") .style("visibility", "hidden") var svg = d3.select("svg"); var mask = svg.append("defs").append("mask").attr("id", "mask").append("g"); //プロジェクション設定 var projection = d3.geo .mercator() //投影法の指定 .scale(200000) //スケール(ズーム)の指定 .translate([400,600]) .center([139.0634281, 36.3894816]); //中心の座標を指定 //geoパスジェネレーター生成 var path = d3.geo.path().projection(projection); //cellを表示するグループを作成 var cellgroup = svg.append("svg:g").attr("id", "cells"); pointdata.forEach(function(d) { var xy = projection(d.geometry.coordinates); positions.push({x:xy[0], y:xy[1], targetClass:".cell"+d.properties['OBJECTID'], properties:d.properties}); //位置情報→ピクセル }); //ボロノイ変換関数 var voronoi = d3.geom.voronoi() .x(function(d){ return d.x }) .y(function(d){ return d.y }); var polygons = voronoi(positions); //境界要素追加 var cell = svg.selectAll(".voronoi") .data(pointdata) .enter() .append("svg:path") .attr({ "class":function(d, i){return "voronoi cell" + pointdata[i].properties['OBJECTID']}, "d":function(d, i) {if(!polygons[i]) return ; return "M" + polygons[i].join("L") + "Z"}, "stroke": "#ccc", "stroke-width":2, fill:function(d, i){ return colorGen() }, "fill-opacity": 0.5, "mask":"url(#mask)" }); //地形(マスク)要素追加 var maskmap = mask.append("g") .selectAll(".mask") .data(geodata) .enter() .append("svg:path") .attr({ "class":"mask", "d":path, "fill":"white", "stroke": "black", "stroke-width":2 }); //地形(強調用)要素追加 var map = svg.append("g") .selectAll(".map") .data(geodata) .enter() .append("svg:path") .attr({ "class":"map", "d": path, "fill":"white", "fill-opacity":0, "stroke": "white", "stroke-opacity":1 }) .on("mouseover", function(d) { tooltip.style("visibility", "visible"); }) .on("mouseout", function(d) { tooltip.style("visibility", "hidden"); }) .on("mousemove", function(d){ var content = "<h2>"+d.properties['町名']+"</h2>" + "<p>人口:" + d.properties['人口'] +"</p>" + "<p>世帯:" + d.properties['世帯'] + "</p>"; tooltip .style("top", (d3.event.pageY-10)+"px") .style("left",(d3.event.pageX+10)+"px") .html(content); }); //母点要素追加 var point = svg.selectAll("point") .data(positions) .enter() .append("svg:circle") .attr({ "cx":function(d, i) { return positions[i].x; }, "cy":function(d, i) { return positions[i].y; }, "r":4, fill:"#1f3134" }) .on("mouseover", function(d) { tooltip.style("visibility", "visible"); console.log(d); d3.selectAll(d.targetClass).classed("emphasis", true); }) .on("mouseout", function(d) { tooltip.style("visibility", "hidden"); d3.selectAll(d.targetClass).classed("emphasis", false); }) .on("mousemove", function(d){ var content = "<center><h2>避難所<h2></center>" + "<p>名称:" + d.properties['一次避難所'] +"</p>" + "<p>所在地:" + d.properties['所在地'] +"</p>" ; tooltip .style("top", (d3.event.pageY-10)+"px") .style("left",(d3.event.pageX+10)+"px") .html(content); }); //ドラッグイベント設定 var drag = d3.behavior.drag().on('drag', function(){ var tl = projection.translate(); projection.translate([tl[0] + d3.event.dx, tl[1] + d3.event.dy]); update(); }); //ズームイベント設定 var zoom = d3.behavior.zoom().on('zoom', function(){ projection.scale(200000 * d3.event.scale); update(); }); //イベントをsvg要素に束縛 svg.call(zoom); svg.call(drag); //ズーム・ドラッグ時のアップデーと function update(){ //地形(強調用)アップデート map.attr('d', path); //地形(マスク)アップデート maskmap.attr('d', path); //ボロノイアップデート var positions = []; pointdata.forEach(function(d) { var xy = projection(d.geometry.coordinates); positions.push({x:xy[0], y:xy[1], targetClass:".cell"+d.properties['OBJECTID'], properties:d.properties}); //位置情報→ピクセル }); var polygons = voronoi(positions); cell.attr("d", function(d, i) {if(!polygons[i]) return ; return "M" + polygons[i].join("L") + "Z"}); //母点アップデート point.attr({ "cx":function(d, i) { return positions[i].x; }, "cy":function(d, i) { return positions[i].y; } }); } } |