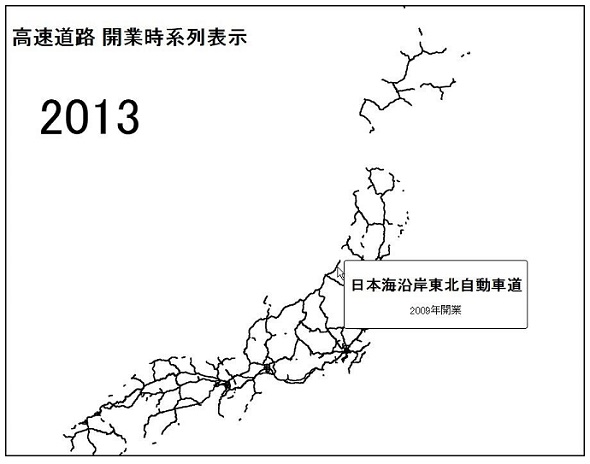
日本に高速道路が出来るまで
Japan and her National highways.
というGif画像を見つけ、これと似たようなものをD3.jsで作ってみました。
国土数値情報の「高速道路時系列データ」から取得した高速道路情報を開業年毎に表示しています。
サンプル
|
1 2 3 4 5 6 7 8 9 10 11 12 13 14 15 16 17 18 19 20 21 22 23 24 25 26 27 28 29 30 31 32 33 34 35 36 37 38 39 40 41 42 43 44 45 46 47 48 49 50 51 52 53 54 55 56 57 58 59 60 61 62 63 64 65 66 67 68 69 70 71 72 73 74 75 76 77 78 79 80 81 82 83 84 85 86 87 88 89 90 91 92 93 94 95 96 97 98 99 100 101 102 103 104 105 106 107 |
d3.json("highway.topojson", function(json){ draw(json); }) function draw(json){ //geojsonデータに変換 var geodata = topojson.feature(json, json.objects.highway); //開業年のリストを取得 var yearList = d3.keys(d3.nest() .key(function(d) { return d.properties["N06_002"]; }) .map(geodata.features)); //ツールチップ要素追加 var tooltip = d3.select("body") .append("div") .attr("class", "tooltip") .style("position", "absolute") .style("z-index", "10") .style("visibility", "hidden") //svg要取得 var svg = d3.select("svg"); //プロジェクション関数生成 var projection = d3.geo .mercator() //投影法の指定 .scale(2500) //スケール(ズーム)の指定 .translate([500 , 500]) //表示位置調整 .center([139.0634281, 36.3894816]); //中心の座標を指定 //パスジェネレーター生成 var path = d3.geo.path().projection(projection); //パスジェネレーター //道路描画 svg.selectAll("path") .data(geodata.features) .enter() .append("path") .attr({ "class": function(d){ return "load l" + d.properties["N06_002"] }, "d":path, "fill":"none", "stroke":"red", "stroke-width": 2, "stroke-opacity": 0 //最初は透明にしておく }) .on("mouseover", function(d) { tooltip.style("visibility", "visible"); }) .on("mouseout", function(d) { tooltip.style("visibility", "hidden"); }) .on("mousemove", function(d){ var content = "<center>" + "<h2>" + d.properties["N06_007"] + "</h2>" + "<p>" + d.properties["N06_002"] + "年開業</p>" + "</center>"; tooltip .style("top", (d3.event.pageY-10)+"px") .style("left",(d3.event.pageX+10)+"px") .html(content); }); //年表示用テキスト要素追加 var text = svg.append("text") .attr({ "font-size":80, "x":50, "y":200 }) .text(yearList[0]); //道路を表示する var show = function(year){ text.text(year); var load = d3.selectAll(".l"+year).transition().duration(1000).attr({ "stroke": "red", "stroke-opacity":1 }).call(endall, function() { d3.selectAll(".l"+year).attr("stroke", "black"); //表示が完了したら黒くする }); } //ゆっくりループ var loop = function(array, callback, interval){ array.forEach(function(d, i){ setTimeout(function(){ callback(d); }, i * interval); }); } //1100ms 事にyearListの値をshow関数に渡して実行する loop(yearList, show, 1100); //トランジション終了後にコールバックを実行するヘルパー関数 function endall(transition, callback) { var n = 0; transition .each(function() { ++n; }) .each("end", function() { if (!--n) callback.apply(this, arguments); }); }; } |