【D3.js】 テーブルを使ったヒートマップ(Google Analytics 可視化)
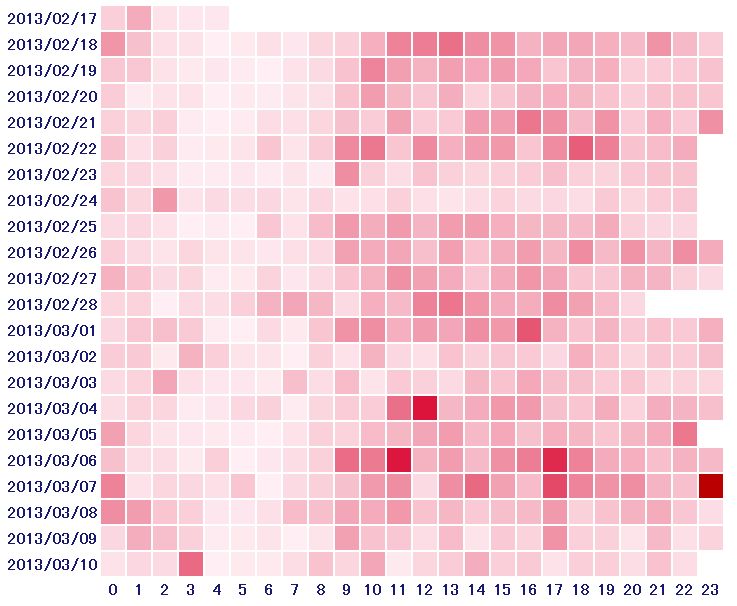
Google Analyticsからエクスポートしたデータ(日時、時間毎の訪問者数)を元にd3.jsを使ってテーブルを作成しました。
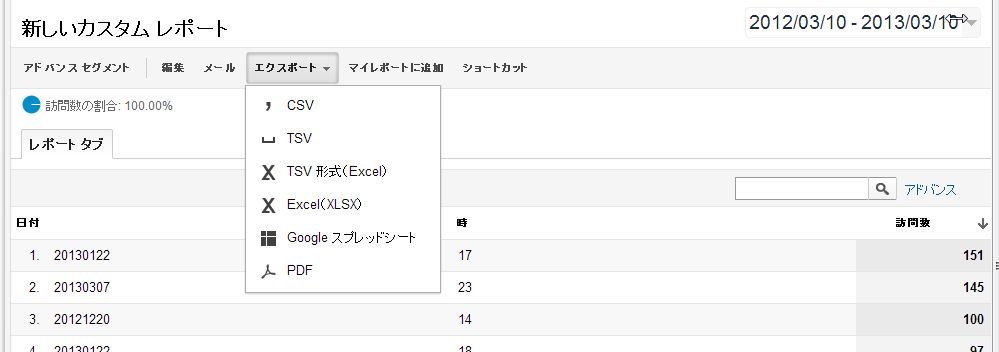
下記のようなカスタムレポートを作成しCSVでエクスポートしています


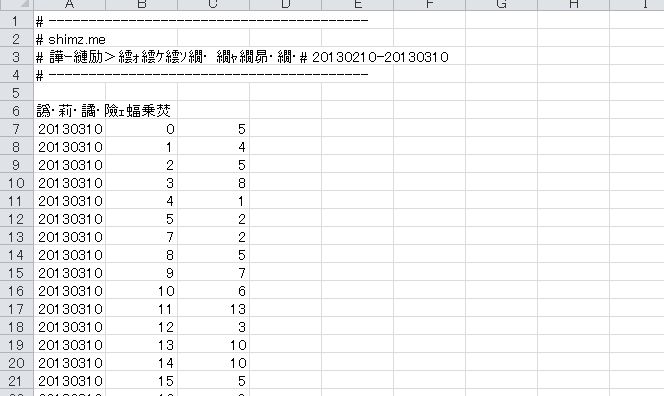
ダウンロードしたcsvには余計なノイズが入っているので削除します。
↓6行目まで要らない

これでデータの準備が完成。
|
1 2 3 4 5 6 7 8 9 10 11 12 13 14 15 16 17 18 19 20 21 22 23 24 25 26 27 28 29 30 31 32 33 34 35 36 37 38 39 40 41 42 43 44 45 46 47 48 49 50 51 52 53 54 55 56 57 |
d3.csv('ga.csv', function(csv){ //csvデータの読み込み var max = d3.max(csv, function(d){ return d.visitors }); //訪問者数の最大値取得 var colorScale = d3.scale.linear().domain([0, max]).range(["#FFF0F5", "#DC143C"]); //カラースケールを作成 var hours = d3.range(24); //時間表示用 var data = d3.nest().key(function(d){return d.date;}).entries(csv); //CSVから取得したデータをdateフィールドの値でネスト //console.log(data); var tbody = d3.select('body').append('table').append('tbody'); //table作成 var tfoot = d3.select('table').append('tfoot'); //tableにtfootをappend tfoot.append('th'); //空th追加 //tfootに時間thを追加 tfoot.selectAll('class') .data(hours) .enter() .append('th') .attr("class", "hours") .text(function(d){ return d}); //tr追加 var trs = tbody.selectAll('tr') .data(data) .enter() .append('tr') //thに年月日を追加 trs.append('th').text(function(d){ var Year = d.key.substring(0, 4); var Month = d.key.substring(4, 6); var Day = d.key.substring(6, 8); var text = Year + "/" + Month + "/" + Day; return text; }); //td追加 trs.selectAll('td') .data(function(d){ return d.values} ) .enter() .append('td') .style("background-color", function(d){ return colorScale(d.visitors); }) .on('mouseover', function(d){ d3.select(this).text(d.visitors); //mouoverした際に訪問者数を表示 }) .on("mouseout", function(d){ d3.select(this).text(""); }); }); |