WebixとD3.jsを使ってレスポンシブなグラフを作成する
Webix Advent Calendar 2014 16日目の記事です。
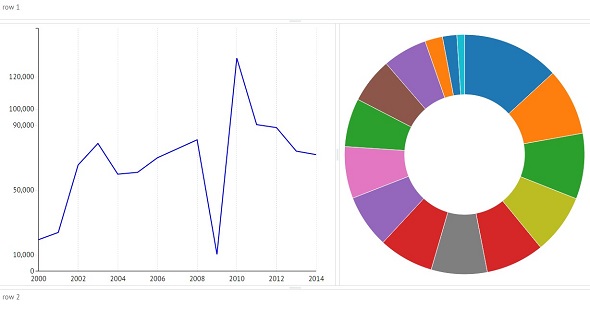
今回はWebixにD3.jsを組み込んでグラフを表示します。
コンポーネントとして表示したグラフはウインドウや境界線を移動した際に、自動的にコンポーネントのサイズにグラフがリサイズされます。
カスタムコンポーネント
WebixのコンポーネントとしてD3を利用できるカスタムコンポーネントを作成します。カスタムコンポーネントの作り方についてはまた別途説明するので、今回は下記コードを保存しWebixライブラリとともに外部ファイルとして読み込んでください。
|
1 2 3 4 5 6 7 8 9 10 11 12 13 14 15 16 17 18 19 20 21 22 23 24 25 26 27 28 29 30 31 32 33 34 35 36 37 38 39 40 41 |
webix.protoUI({ name:"d3-chart", defaults:{ }, $init:function(){ this._ready_awaits = 0; this.attachEvent("onAfterLoad", function(){ if (this._ready_awaits == 2){ if (this.config.ready){ this.config.ready.call(this, this.data); this._ready_awaits = 3; } } else this._ready_awaits = 1; }); webix.delay(webix.bind(this._render_once, this)); }, _render_once:function(){ //ライブラリが読み込まれていない時の読み込み先を指定 webix.require("d3.v3.min.js", function(first_init){ if (this.config.init) this.config.init.call(this); if (this._ready_awaits == 1 && this.config.ready){ this.config.ready.call(this, this.data); this._ready_awaits = 3; } else this._ready_awaits = 2; }, this); }, $setSize:function(x,y){ if (webix.ui.view.prototype.$setSize.call(this,x,y)){ if (this._ready_awaits == 3 && this.config.resize){ this.$view.innerHTML = ""; this.config.ready.call(this, this.data); } } } }, webix.AtomDataLoader, webix.EventSystem, webix.ui.view ); |
サンプル
今回はD3ライブラリをwebixコンポーネントとは別に読み込みます。
(コンポーネント側で読み込むことも可能です)
|
1 2 3 4 5 6 7 |
<script src="http:////cdnjs.cloudflare.com/ajax/libs/d3/3.5.2/d3.min.js"></script> <script src="http://shimz.me/libs/webix/codebase/webix.js"></script> <script src="../d3-chart.js"></script> <script type="text/javascript"> webix.require.disabled = true; //ライブラリの自働読み込みを無効にする </script> |
■ 折れ線グラフを表示する
|
1 2 3 4 5 6 7 8 9 10 11 12 13 14 15 16 17 18 19 20 21 22 23 24 25 26 27 28 29 30 31 32 33 34 35 36 37 38 39 40 41 42 43 44 45 46 47 48 49 50 51 52 53 54 55 56 57 58 59 60 61 62 63 64 65 66 67 68 69 70 71 72 73 74 75 76 77 78 |
var line_chart = { view:"d3-chart", resize:true, url:"../_data/test.json", ready:function(){ var dataSet = this.data.test; //折れ線グラフを表示するエリアのマージン var margin = { top: 10, right: 40, bottom: 30, left: 80 } //折れ線グラフを表示するステージのサイズ var stageW = this.$width - margin.left - margin.right; var stageH = this.$height - margin.top - margin.bottom; //ステージ追加 var svg = d3.select(this.$view) .append("svg") .attr({ "width": this.$width, "height": this.$height }); //svg要素の中にg(グループ)要素を追加 var stage = svg.append("g") .attr("transform", "translate(" + [margin.left, margin.top] + ")"); //スケール設定 var xScale = d3.scale.linear().range([0, stageW]); var yScale = d3.scale.linear().range([stageH, 0]); //スケールのドメイン範囲を設定(手抜き) xScale.domain([2000, 2014]); yScale.domain([0, 150000]); //ライン描画関数を作成 var valueLine = d3.svg.line() .x(function(d){ return xScale(+d['year']) }) .y(function(d){ return yScale(+d['count']) }) //折れ線グラフを描画 stage.append("path") .attr({ "d": valueLine(dataSet), fill: "none", stroke: "blue", "stroke-width": 2 }); //x軸の目盛りを描画 var xAxis = d3.svg.axis().scale(xScale).orient('bottom') .ticks(10) .tickFormat(d3.format("0f")) .innerTickSize(-stageH) // 目盛線の長さ(内側) .outerTickSize(0) // 目盛線の長さ(外側) .tickPadding(10); // 目盛線とテキストの間の長さ stage.append("g") .attr({ "class": "x axis", "transform": "translate("+[0, stageH]+")", }) .call(xAxis); //y軸の目盛りを描画 var yAxis = d3.svg.axis().scale(yScale) .orient('left') .ticks(10) ; stage.append("g") .attr({ "class": "y axis", }).call(yAxis); } } |
■ 円グラフを表示する
|
1 2 3 4 5 6 7 8 9 10 11 12 13 14 15 16 17 18 19 20 21 22 23 24 25 26 27 28 29 30 31 32 33 34 35 36 37 38 39 40 41 42 43 44 45 46 47 48 49 50 51 52 |
var pie_chart = { view:"d3-chart", resize:true, url:"../_data/test.json", ready:function(){ var colorScale = d3.scale.category10(); var dataSet = this.data.test; //折れ線グラフを表示するエリアのマージン var margin = { top: 10, right: 10, bottom: 10, left: 10 } //折れ線グラフを表示するステージのサイズ var stageW = this.$width - margin.left - margin.right; var stageH = this.$height - margin.top - margin.bottom; var r = (stageW > stageH) ? Math.floor(stageH/2) : Math.floor(stageW/2); //ステージ追加 var svg = d3.select(this.$view) .append("svg") .attr({ "width": this.$width, "height": this.$height }); var arcsGroup = svg .data([dataSet]) //pieで変換するために要素1の配列としてデータを渡す .append("svg:g") .attr("transform", "translate(" + Math.floor( this.$width/2) + "," + Math.floor( this.$height/2) + ")") var pie = d3.layout.pie().value(function(d) {console.log(d); return +d.count; }); var arc = d3.svg.arc().outerRadius(r).innerRadius(Math.floor(r/2)); var sliceGroup = arcsGroup.selectAll("g.slice") .data(pie) .enter() .append("svg:g") .attr("class", "slice"); var slicePaths = sliceGroup.append("svg:path") .attr({ fill: function(d, i){ return colorScale(i); }, stroke:"white", d: arc }); } } |
■ レイアウト
|
1 2 3 4 5 6 7 8 9 10 11 12 13 14 |
webix.ui({ id:"layout", rows:[ {template:"header", height:40}, {view:"resizer"}, { cols:[ line_chart, //折れ線グラフを表示 {view:"resizer"}, pie_chart //円グラフを表示 ]}, {view:"resizer"}, {template:"fotter", height:40} ] }); |