【D3.js】stereographicプロジェクションを使って全天球表示
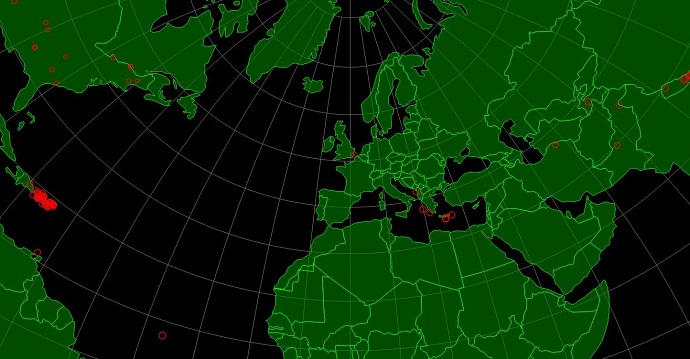
アメリカ地質調査所(USGS)が公開している過去7日間の地震データを地図上に表示しています。
単純に表示するのもなんだったので、d3.geo.stereographicを利用して全天球表示というのをやってみました。グリグリ動いて楽しいのですが……見やすくは無いですね。
サンプル
|
1 2 3 4 5 6 7 8 9 10 11 12 13 14 15 16 17 18 19 20 21 22 23 24 25 26 27 28 29 30 31 32 33 34 35 36 37 38 39 40 41 42 43 44 45 46 47 48 49 50 51 52 53 54 55 56 57 58 59 60 61 62 63 64 65 66 67 68 69 70 71 72 73 74 75 76 77 78 79 80 81 82 83 84 85 86 87 88 89 90 91 92 93 94 95 96 97 98 99 100 101 102 103 104 105 106 107 108 109 110 111 112 113 114 115 116 117 118 119 120 121 122 123 124 125 126 127 128 |
d3.json('../../_geodata/conuntries.geojson', function(data) { d3.json('http://earthquake.usgs.gov/earthquakes/feed/v1.0/summary/all_week.geojson', function(earthquakes){ main(data, earthquakes); }); }); function main(mapdata, earthquakes){ var div = d3.select('body').append('div').attr('id', 'stereographic'); var width = parseInt(div.style('width'), 10); var height = parseInt(div.style('height'), 10); var svg = div.append('svg') .attr('width', width) .attr('height', height); // プロジェクションの回転角を収納 var rotate = {x: 0, y: 45}; // プロジェクション設定(全天球表示) var projection = d3.geo.stereographic() .scale(4.5 * height / Math.PI) .translate([width / 2, height / 2]) .clipAngle(120) .rotate([rotate.x, -rotate.y]) // パスジェネレーター生成 var path = d3.geo.path().projection(projection); /********************************************************** * アウトライン(外周)を追加 **********************************************************/ svg.append('path').datum({type: 'Sphere'}) .attr({ 'class': 'cellestial-globe', 'd': path }); /********************************************************** * グリッドラインを追加 **********************************************************/ var graticule = d3.geo.graticule(); var lines = svg.selectAll('path.graticule').data([graticule()]) .enter().append('path') .attr({ 'class': 'graticule', 'd': path, 'stroke': 'gray' }); /********************************************************** * 地形を追加 **********************************************************/ var map = svg.selectAll('path.map').data(mapdata.features) .enter().append('path') .attr({ 'class': 'map', 'd':path, 'stroke': 'lime', 'fill':'green', 'fill-opacity':0.6 }) /********************************************************** * 震度サークルを追加 **********************************************************/ //震度スケール設定 var earthquakesScale = d3.scale.sqrt().domain([0, 10]).rangeRound([0, 10]) //地震サークル追加 var eqCircle = svg.selectAll('circle.earthquake').data(earthquakes.features) .enter().append('circle') .attr({ 'class': 'earthquake', 'r':function(d){return earthquakesScale(d.properties.mag) }, 'fill': 'none', 'stroke': 'red', 'stroke-width':2, 'stroke-opacity': 0.8 }); //緯度経度→xy座標変換 earthquakes.features.forEach(function(d){ d.xy = projection(d.geometry.coordinates) }); eqCircle.attr({ 'cx': function(d){ return d.xy[0] }, 'cy': function(d){ return d.xy[1] } }); /********************************************************** * ドラッグイベント処理 **********************************************************/ //ドラッグ時ビヘイビア 設定 var dragBehavior = d3.behavior.drag() .origin(Object) .on('drag', drag); //マウスドラッグイベントキャッチ用オーバーレイを追加 var overlay = svg.selectAll('rect').data([rotate]) .enter().append('rect'); overlay .attr('width', width) .attr('height', height) .attr('fill-opacity', 0); overlay.call(dragBehavior); //ドラッグ時処理 function drag(d) { projection.rotate([(d.x = d3.event.x) / 2, -(d.y = d3.event.y) / 2]); lines.attr('d', path); map.attr('d', path); earthquakes.features.forEach(function(d){ d.xy = projection(d.geometry.coordinates) }); eqCircle.attr({ 'cx': function(d){ return d.xy[0] }, 'cy': function(d){ return d.xy[1] } }); } } |