ハート型の地図
ハッピーバレンタイン(1日遅れ)
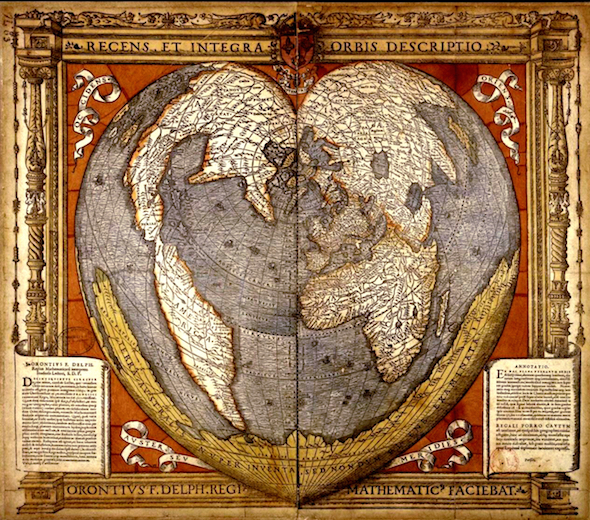
上記はオロンス・フィネ(オロンティウス・フィネウス)さん作成のハート型の地図です。この時期になると、やたらと海外のGeo系ブログで見かける一部の人にとってはおなじみの地図だったりします。
実用性はまったく無さそうなのですが形が面白いですね。
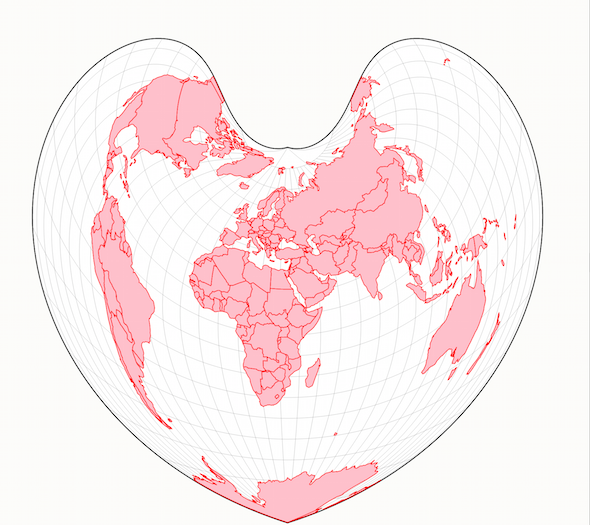
D3.jsにも同様の投影法が用意されているので、サンプルを作ってみました。
サンプル
D3.jsでボンヌ図法での描画方法です。ついでに回転させてます。

D3.jsのprojectionプラグインが必要なので読み込みます。
|
1 2 |
<script src="https://cdnjs.cloudflare.com/ajax/libs/d3/3.5.3/d3.min.js"></script> <script src="https://cdnjs.cloudflare.com/ajax/libs/d3-geo-projection/0.2.9/d3.geo.projection.min.js"></script> |
|
1 2 3 4 5 6 7 8 9 10 11 12 13 14 15 16 17 18 19 20 21 22 23 24 25 26 27 28 29 30 31 32 33 34 35 36 37 38 39 40 41 42 43 44 45 46 47 48 49 50 51 52 53 54 55 56 57 58 59 60 61 62 63 64 65 66 67 68 69 70 71 72 73 74 75 |
//ポリゴンデータ読み込み d3.json("world.geojson", function(json) { mapdraw(json); }); function mapdraw(json){ var width = 960; var height = 960; var feature = json.features; //ボンヌ図法を指定する var projection = d3.geo.bonne() .center([0, 27]) .scale(180) .translate([width / 2, height / 2]) .precision(.1); var path = d3.geo.path().projection(projection); var svg = d3.select("body").append('svg') .attr("width", width) .attr("height", height); /*外枠描画用のpath要素を追加する*/ var border = svg.append("defs").append("path") .datum({type: "Sphere"}) .attr("id", "sphere") svg.append("use") .attr("class", "stroke") .attr("xlink:href", "#sphere"); svg.append("use") .attr("class", "fill") .attr("xlink:href", "#sphere"); /*グリッド描画用のpath要素を追加する*/ var graticule = d3.geo.graticule(); var grid = svg.append("path") .datum(graticule) .attr("class", "graticule") /*大陸描画用のpath要素を追加する*/ var land = svg.selectAll('.land') .data(feature) .enter() .append('path') .attr({ "stroke": "red", "fill": "pink" }); //パスを生成する grid.attr("d", path) land.attr("d", path) border.attr("d", path) //x軸で回転させる setInterval(rotate(), 100); function rotate(){ var i = 0; return function(){ projection.rotate([i++, 0, 0]) grid.attr("d", path) land.attr("d", path) } } } |