deck.glでGeoJSONを可視化する
この記事はdeck.gl Advent Calendar 2021 参加記事です。
概要
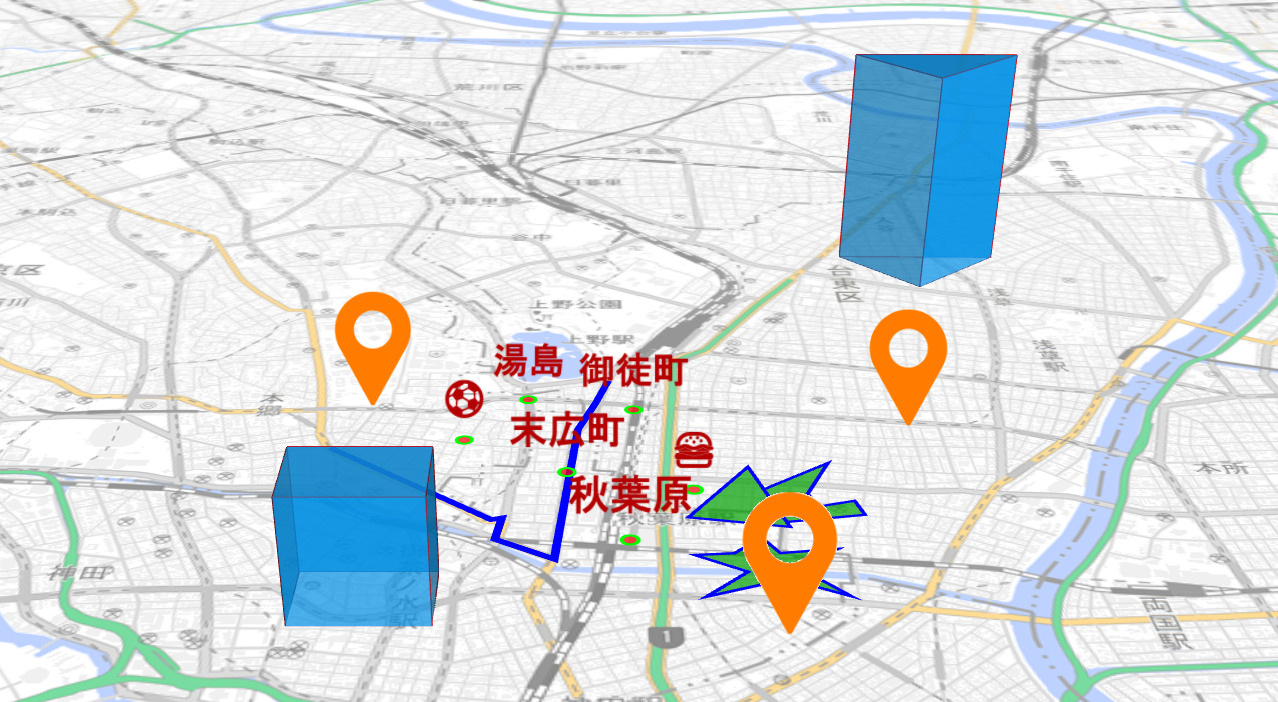
deck.glには様々なレイヤーが用意されていますが、その中でも最も汎用性が高いのがGeoJsonLayerになります。
GeoJsonLayerでは、ポイント・ライン・ポリゴンといった基本的な地物の表示に対応しているほか、アイコンの表示、テキストラベルの表示、3D表現までが可能です。
GeoJsonLayerの使い方を覚えるだけで格段にdeck.glが使いやすくなるので、ぜひ使ってみてください。
サンプルコード
解説
GeoJsonLayerのdataプロパティにはGeoJSON形式のオブジェクトを渡す以外に、GeoJSONファイルへのURLを指定することで直接データの読み込みを行うことができます。
ポイントデータに関してはpointTypeプロパティで指定することで、サークル、アイコン、テキストラベルの出力を行うことができます。
|
1 2 3 4 5 6 7 8 9 10 11 12 13 14 15 16 17 18 19 20 21 22 23 24 25 26 27 28 29 30 31 32 33 34 35 36 37 38 39 40 41 42 43 44 45 46 47 48 49 50 51 52 53 54 55 56 57 58 59 60 61 62 63 64 65 66 67 68 69 70 71 72 73 74 75 76 77 78 79 80 81 82 83 84 85 86 87 88 89 90 91 92 93 94 95 96 97 98 99 |
import { GeoJsonLayer } from "deck.gl"; export function renderLayers(props) { const { pointData } = props; //pointデータの読み込みが終わるまで処理をスルー if (!pointData) return; //属性値のラベルから必要なキャラクターセットを取得する const tmp = pointData.features .map((d) => Array.from(d.properties.label)) //ラベル文字列を収集 .flat(); //重複を削除 const charaSet = Array.from(new Set(tmp)) //ポイントデータをサークル+テキストとして出力 const point = new GeoJsonLayer({ id: "point", data: pointData, stroked: true, filled: true, pointType: "circle+text", //circle, text, iconを設定可能、+接続詞で複数のタイプも同時選択できる //circleの設定 getPointRadius: 30, //circleの半径 getFillColor: [255, 0, 0, 180], getLineColor: [0, 255, 0, 255], lineWidthMinPixels: 2, //テキストラベル設定 getText: (d) => d.properties.label, //属性値のlabelの値をテキストラベルとして表示する getTextPixelOffset: [0, -20], //テキストラベルの相対的な位置 getTextColor: [180, 0, 0], textFontWeight: "bold", textSizeScale: 0.6, textCharacterSet: charaSet //生成したキャラクターセットをdeck.glに渡す }); //ポイントデータをiconとして出力 const icon = new GeoJsonLayer({ id: "icon", data: "./data/icon.geojson", stroked: true, filled: true, pointType: "icon", //iconの設定 getIcon: () => { return { url: "./img/marker.png", x: 0, //画像読み込みのX軸オフセット y: 0, //画像読み込みのY軸オフセット anchorY: 512, //Y軸の表示位置(通常画像の縦幅に合わせる) width: 512, //アイコン画像の横幅 height: 512, //アイコン画像の縦幅 mask: true //tureにするとアイコン画像の色の上塗りなどが可能になる }}, iconSizeScale: 60, getIconColor: [255, 124, 0] //オレンジ色 }); //ラインデータを出力 const line = new GeoJsonLayer({ id: "line", data: "./data/line.geojson", stroked: true, filled: true, getLineColor: [0, 0, 255, 255], lineWidthMinPixels: 4 }); //ポリゴンデータを出力 const polygon = new GeoJsonLayer({ id: "polygon", data: "./data/polygon.geojson", stroked: true, filled: true, getFillColor: [0, 160, 0, 180], getLineColor: [0, 0, 255, 255], lineWidthMinPixels: 2 }); //ポリゴンデータを出力 const polygon3D = new GeoJsonLayer({ id: "polygon3D", data: "./data/3d-polygon.geojson", stroked: true, filled: true, extruded: true, // 3d表示を有効にする wireframe: true, //アウトラインを表示する getFillColor: [0, 160, 255, 180], getLineColor: [255, 0, 0, 255], getElevation: (d, { index }) => { //ポリゴンの高さを指定する const i = index + 1; return 500 * i; //500m * indexを高さに指定 } }); //配列の順でレイヤーの重なり順が変わります。 return [line, point, icon, polygon, polygon3D]; } |
GeoJsonLayerは様々な表示形式に対応するため、設定項目が多岐にわたります。
詳しくは公式サイトを参照ください。