Google Map上に平成26年高崎市の公示地価(GeoJSONデータ)を表示する
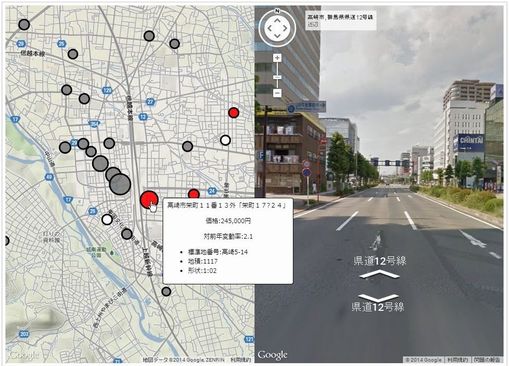
Google Maps APIでサポートされたGeoJSON表示機能を使って、高崎市の公示地価を地図上にプロットしてみました。(一部、D3.jsを使用しています)
赤いサークルが前年度よりプラスになった場所です。
「高崎パブリックセンター」予定地周辺の地価がやはり上がっているようです。
【参照】
Google Map上にGeoJSONデータを表示する
サンプル
|
1 2 3 4 5 6 7 8 9 10 11 12 13 14 15 16 17 18 19 20 21 22 23 24 25 26 27 28 29 30 31 32 33 34 35 36 37 38 39 40 41 42 43 44 45 46 47 48 49 50 51 52 53 54 55 56 57 58 59 60 61 62 63 64 65 66 67 68 69 70 71 72 73 74 75 76 77 78 79 80 81 82 83 84 85 86 87 88 89 90 91 92 93 94 95 96 97 98 99 100 101 102 103 104 105 106 107 108 109 110 111 112 113 114 115 116 117 118 119 120 121 122 123 124 125 126 127 |
google.maps.event.addDomListener(window, 'load', function() { //ツールチップ要素を追加 var tooltip = d3.select("body") .append("div") .attr("class", "tooltip") .style("position", "absolute") .style("z-index", "999999") .style("visibility", "hidden") //Google Maps初期化 var map = new google.maps.Map(document.getElementById('map-canvas'), { center: { lat: 36.322356, lng: 139.013057 }, zoom: 13, mapTypeId: google.maps.MapTypeId.TERRAIN, disableDefaultUI: true }); //マーカーのスタイルを指定 var styleFeature = function(max){ //正規化関数 var rScale = d3.scale.sqrt().domain([0, max]).range([0, 20]); return function(feature) { var color = function(){ if(/△/.test(feature.getProperty('対前年変動率'))){ return 'gray' //前年度より下がった地域 }else if(feature.getProperty('対前年変動率') == 0){ return 'white' //変動なし }else{ return 'red' //前年度より上がった地域 } }; return { icon: { //iconのスタイル指定 path: google.maps.SymbolPath.CIRCLE, scale: rScale(+feature.getProperty('価格')), fillColor: color(), fillOpacity: 0.9, strokeColor: "black", strokeWeight: 3 } }; }; } //ストリートビュー初期化 var streetViewDiv = document.getElementById("streetview"); var stOptions = { pov: { heading: 00, pitch: 0, zoom: 2 } }; //ストリートビューオブジェクトの生成 var streetViewPanorama = new google.maps.StreetViewPanorama(streetViewDiv, stOptions); var streetViewService = new google.maps.StreetViewService(); //GeoJSONデータ読み込み d3.json('landprice.geojson', function(data) { //データレイヤーに追加 map.data.addGeoJson(data); //価格の最大値取得 var max = d3.max(data.features, function(d){ return +d.properties['価格'] }) //データレイヤのスタイルを指定 map.data.setStyle(styleFeature(max)); //イベント設定 map.data.addListener('click', mouseClick); map.data.addListener('mouseover', mouseOmover); map.data.addListener('mouseout', mouseOut); }); function mouseClick(e) { //features->propertiesのaddressデータをクリック時に表示する showStreetView(e.feature.getGeometry().get()); } function mouseOmover(e){ //ツールチップを表示 tooltip.style("visibility", "visible"); var content = "<center>"+e.feature.getProperty('住所'); content += "<p>価格:"+addFigure(e.feature.getProperty('価格'))+"</p>"; content += "<p>対前年変動率:"+e.feature.getProperty('対前年変動率')+"</p>"; content +="</center>"; content += "<ul>"; content += "<li>標準地番号:"+e.feature.getProperty('標準地番号')+"</li>"; content += "<li>地積:"+e.feature.getProperty('地積')+"</li>"; content += "<li>形状:"+e.feature.getProperty('形状')+"</li>"; tooltip .style("top", (e.Va.pageY-10)+"px") .style("left",(e.Va.pageX+10)+"px") .html(content); } function mouseOut(e) { //ツールチップを非表示 tooltip.style("visibility", "hidden"); } //ストリートビューを表示 function showStreetView(latlng){ //var latlng = new google.maps.LatLng(d['緯度'], d['経度']); streetViewPanorama.setVisible(false); streetViewService.getPanoramaByLocation(latlng, 50, function(status){ if(status){ streetViewPanorama.setPosition(latlng); streetViewPanorama.setVisible(true); }else{ alert("StreetView 非対応エリアです"); }; }); } function addFigure(d){ return String(d).replace( /(d)(?=(ddd)+(?!d))/g, '$1,' ) + "円"; } }); |