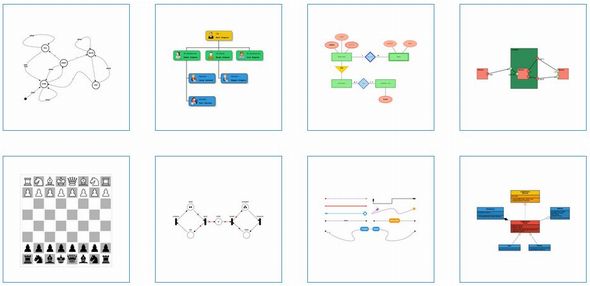
Javascriptでフロー図や組織図、UML図などを簡単に表示できるライブラリ「JointJS」
Microsoft Visioを使って作成するようなタイプの図(ダイアグラム)ですね。
D3.jsを使って作成することもできますが、jointJSの方が用途に特化されている分簡単に作成することができます。
サクッと組織図やフローチャートなどを作成したいときに便利です。
サンプル

作成する図のタイプによってはプラグインを読み込む必要があります。
|
1 |
<script src="../joint.js"></script> |
|
1 2 3 4 5 6 7 8 9 10 11 12 13 14 15 16 17 18 19 20 21 22 23 24 25 26 27 28 29 30 31 32 33 34 35 36 37 38 39 40 41 42 43 44 45 46 47 48 49 50 51 52 53 54 55 56 57 58 59 60 61 62 63 64 |
//graphモデルの生成 var graph = new joint.dia.Graph; //paper(グラフを表示するステージ)の生成 var paper = new joint.dia.Paper({ el: $('#myholder'), width: 600, height: 200, model: graph }); /* * shape生成 */ //rectシェイプオブジェクトの生成 var rect = new joint.shapes.basic.Rect({ position: { x: 100, y: 30 }, size: { width: 100, height: 30 }, attrs: { rect: { fill: 'blue' }, text: { text: 'my box', fill: 'white' } } }); //rectシェイプの属性を設定 rect.attr({ rect: { fill: '#2C3E50', rx: 5, ry: 5, 'stroke-width': 2, stroke: 'black' }, text: { text: 'my label', fill: '#3498DB', 'font-size': 18, 'font-weight': 'bold', 'font-variant': 'small-caps', 'text-transform': 'capitalize' } }); //rectオブジェクトからクローン(rect2)を生成 var rect2 = rect.clone(); //rect2の位置を設定 rect2.translate(300,50); /* * link生成 */ //linkオブジェクトの生成 var link = new joint.dia.Link({ source: { id: rect.id }, target: { id: rect2.id }, attrs: {} //attrs用の空オブジェクト。これが無いとlink.attrでエラーがでる }); //link属性の設定 link.attr({ '.connection': { stroke: 'blue' }, '.marker-source': { fill: 'red', d: 'M 10 0 L 0 5 L 10 10 z' }, '.marker-target': { fill: 'yellow', d: 'M 10 0 L 0 5 L 10 10 z' } }); //折点の設定 link.set('vertices', [{ x: 300, y: 60 }, { x: 400, y: 60 }, { x: 400, y: 20 }]); //線を滑らかにする link.set('smooth', true); //rectとlinkをグラフに追加する graph.addCells([rect, rect2, link]); |
example