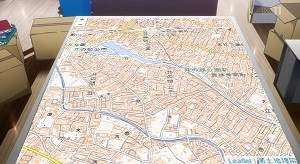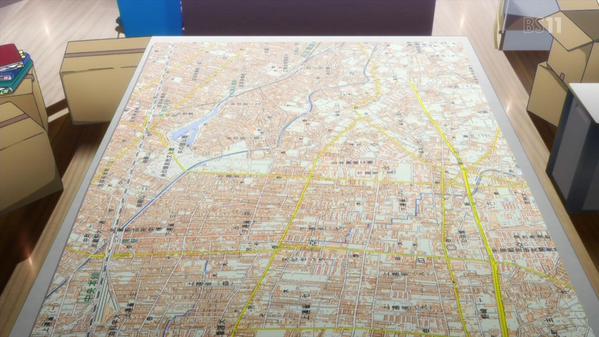
Charlotte(シャーロット)2話に出てきた地図のleaflet版作った。
地理院地図……お前、地理院地図じゃないか!

というわけで、leaflet版作ってみました。
ズームもパンもできるよ!\(^ω^\)( /^ω^)/
ホントは地図の向きも合わせようかと思ったのですが、見づらくなるのと操作しづらくなるのでやめました。
一応、最新版のChromeとFirefoxで動作確認してます。IEもver.10なら動くみたいです。
制作委員会に怒られたら、やめるね!
解説
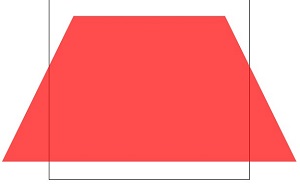
地図部分を透明色でくり抜いた画像をLeafletの上に重ねているだけです。
地図の奥行を出すのにCSS transformを利用しています。
|
1 2 3 4 5 6 7 8 9 10 11 12 13 14 15 16 17 18 19 20 21 22 23 24 25 26 27 28 29 30 31 32 33 34 35 36 37 38 39 40 41 42 43 44 45 46 47 48 49 50 51 52 53 54 55 56 57 58 59 |
<!doctype html> <html lang="jp"> <head> <meta charset="utf-8" /> <title>charlotte Maps</title> <link rel="stylesheet" href="http://cdn.leafletjs.com/leaflet-0.7.3/leaflet.css" /> <style> .container { width: 410px; height: 470px; margin: 0 auto 60px; position: absolute; top:-100px; left: 100px; border: 1px solid black; -webkit-perspective: 600px; -moz-perspective: 600px; -o-perspective: 600px; perspective: 600px; } .panel { width: 100%; height: 100%; position: absolute; opacity: 0.7; color: white; background: red; } #rotate-x .panel { -webkit-transform: rotateX( 55deg ); -moz-transform: rotateX( 55deg ); -o-transform: rotateX( 55deg ); transform: rotateX( 55deg ); } #map { width: 100%; height: 100%; } </style> </head> <body> <div id="rotate-x" class="container"> <div class="panel"> <div id="map"></div> </div> </div> </body> </html> |
地理院地図
正確には表示されているのは「電子国土基本図」です。
leafletで地理院地図を表示するのはとても簡単です。
|
1 2 3 4 5 6 7 8 9 |
var map = L.map('map').setView([35.697735, 139.580483], 15); //地理院地図レイヤー追加 L.tileLayer( 'http://cyberjapandata.gsi.go.jp/xyz/std/{z}/{x}/{y}.png', { attribution: "<a href='http://www.gsi.go.jp/kikakuchousei/kikakuchousei40182.html' target='_blank'>国土地理院</a>" } ).addTo(map); |
