Google Map上にGeoJSONデータを表示する
Google、地図アプリのデベロッパー向けJavaScript APIでGeoJSONをサポート
Google Maps APIでGeoJSONデータがサポートされたらしいので、試してみました。(一部、D3.jsを使用しています)
【参考】
Combining and visualising multiple data sources – Google Maps API — Google Developers
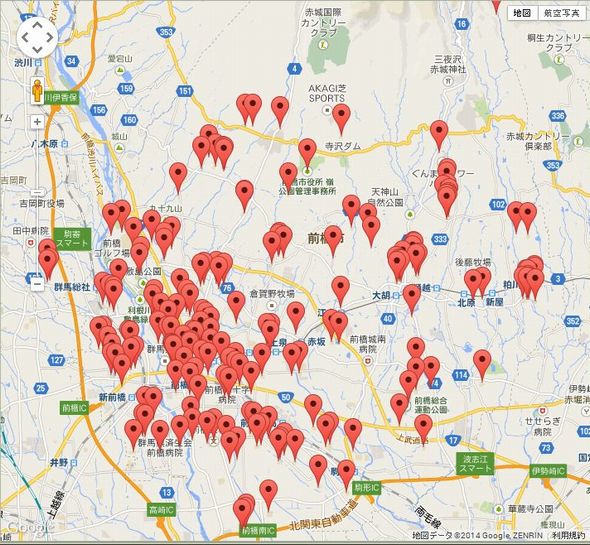
ポイントデータを表示
ポイント(点)データは、スタイルを指定しないとマーカーで表示される。

サンプルコード
|
1 2 3 4 5 6 7 8 9 10 11 12 13 14 15 16 17 18 19 20 21 22 |
google.maps.event.addDomListener(window, 'load', function() { //Google Maps初期化 var map = new google.maps.Map(document.getElementById('map-canvas'), { center: { lat: 36.3894816, lng: 139.0634281 }, zoom: 12 }); //GeoJSONデータ読み込み d3.json('aed.geojson', function(data) { //データレイヤーに追加 map.data.addGeoJson(data); //イベント(マーカークリック時)を設定 map.data.addListener('click', mouseClick); }); function mouseClick(e) { //features->propertiesのaddressデータをクリック時に表示する alert(e.feature.getProperty('address')); } }); |
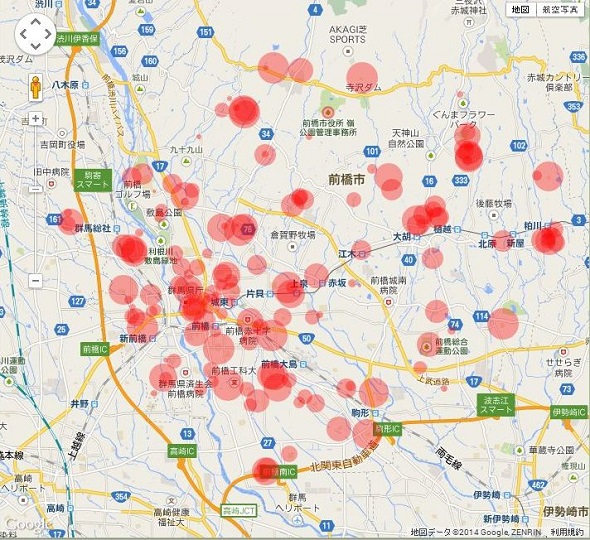
ポイントデータを表示2
サンプル
|
1 2 3 4 5 6 7 8 9 10 11 12 13 14 15 16 17 18 19 20 21 22 23 24 25 26 27 28 29 30 31 32 33 34 35 36 37 38 |
google.maps.event.addDomListener(window, 'load', function() { //Google Maps初期化 var map = new google.maps.Map(document.getElementById('map-canvas'), { center: { lat: 36.3894816, lng: 139.0634281 }, zoom: 12 }); //マーカーのスタイルを指定 var styleFeature = function(feature) { return { icon: { path: google.maps.SymbolPath.CIRCLE, scale: ~~(Math.random() * 20), //円のサイズ(今回はランダムに設定) fillColor: '#f00', fillOpacity: 0.35, strokeWeight: 0 } }; }; //GeoJSONデータ読み込み d3.json('aed.geojson', function(data) { //データレイヤーに追加 map.data.addGeoJson(data); //データレイヤのスタイルを指定 map.data.setStyle(styleFeature); //イベント(マーカークリック時)を設定 map.data.addListener('click', mouseClick); }); function mouseClick(e) { //features->propertiesのaddressデータをクリック時に表示する alert(e.feature.getProperty('address')); } }); |
ポリゴンデータを表示
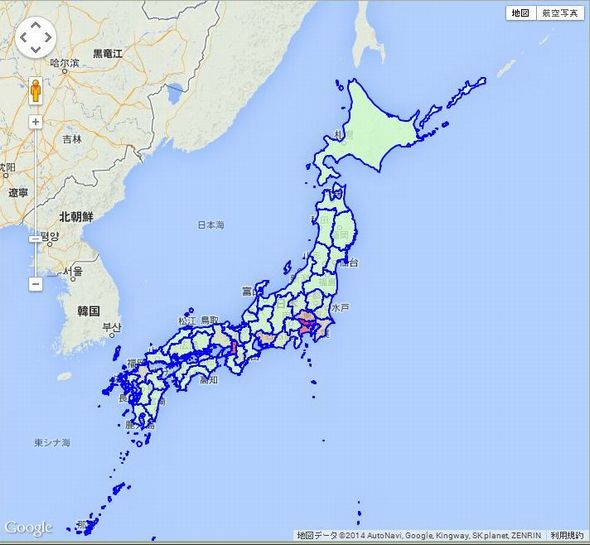
都道府県境界データを表示し、各県の人口密度に合わせて塗り分けをしてみた。

サンプルコード
|
1 2 3 4 5 6 7 8 9 10 11 12 13 14 15 16 17 18 19 20 21 22 23 24 25 26 27 28 29 30 31 32 33 34 35 |
google.maps.event.addDomListener(window, 'load', function() { //Google Maps API初期化 var map = new google.maps.Map(document.getElementById('map-canvas'), { center: { lat: 36.322356, lng: 139.013057 }, zoom: 5 }); //ポリゴンデータのスタイルを指定 var styleFeature = function(max){ //カラースケールを指定 var colorScale = d3.scale.linear().domain([0, max]).range(["#CCFFCC", "red"]); return function(feature){ return { strokeWeight: 2, strokeColor: 'blue', zIndex: 4, fillColor: colorScale(+feature.getProperty('人口密度')), //人口密度によって色を塗り分ける fillOpacity: 0.75, visible: true }; } } //geojsonデータ(ポリゴン)を読み込み d3.json('japank.geojson', function(data) { //各県の人口密度から最大値を取得 var max = d3.max(data.features, function(d){ return +d.properties['人口密度'] }) //データレイヤーに追加 map.data.addGeoJson(data); //データレイヤのスタイルを指定 map.data.setStyle(styleFeature(max)); }); }); |
