GeoJSONを軽くするだけじゃない! TopoJSONクライアント TIPS
単純に、GeoJSON形式のデータを効率よく圧縮してファイルサイズを軽くするものとらえられがちのTopoJSONですが、実はTopoJSONには様々な機能があります。
今回はその中から、クライアント側「topojson.js」で利用できる機能の一部を紹介します。
topojson.neighbors
neighborsメソッドについては以前記事にしたので省略。基本的には、このメソッドにTopoJSONのデータを渡してあげると、各ポリゴン毎に隣接するポリゴンのインデックスの値を配列として返してくれます。
【D3.js】隣接する区画を表示する
topojson.mesh
かいつまんで言うと、TopoJSONのデータを受け取って一本のパスストリング(svg/pathのd要素に渡す値)として返すメソッドです。
コールバックを使ってフィルタリングを行うことで、隣接するパスと単独のパスを分けて出力することができます。地形の外周と境界で表現を変えたいときに等便利。
下記は外周を青、境界を赤で表示しています。
|
1 2 3 4 5 6 7 8 9 10 11 12 13 14 15 16 17 18 19 20 21 22 23 24 25 26 27 28 29 30 31 32 33 34 35 36 |
d3.json("../../_geodata/ken.topojson", function(json) { draw(json); }); function draw(json){ var projection = d3.geo .mercator() //投影法の指定 .scale(2000) //スケール(ズーム)の指定 .translate([500,450]) //表示位置調整 .center([139.0032936, 36.3219088]); //中心の座標を指定 var path = d3.geo.path().projection(projection); //パスジェネレーター var svg = d3.select("svg"); //外周要素追加 svg.append("path") .datum(topojson.mesh(json, json.objects.ken, function(a, b) { return a == b; })) .attr({ "d": path, "fill": "none", "stroke": "blue" }); //境界要素追加 svg.append("path") .datum(topojson.mesh(json, json.objects.ken, function(a, b) { return a !== b; })) .attr({ "d": path, "fill": "none", "stroke": "red" }); } |
topojson.merge
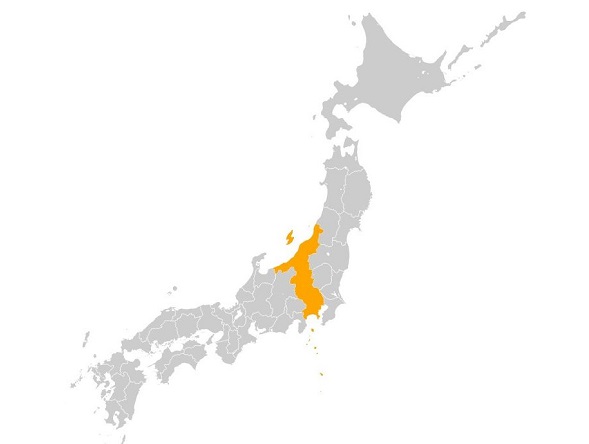
ポリゴンとポリゴンを合成して一つのポリゴンとして表示します。
下記は新潟県、群馬県、埼玉県、東京都、神奈川県をマージして一つのエリアとして表示します。
ユーザーの操作に対して、動的にポリゴンのマージを行うなどもできます。
|
1 2 3 4 5 6 7 8 9 10 11 12 13 14 15 16 17 18 19 20 21 22 23 24 25 26 27 28 29 30 31 32 33 34 35 36 37 38 39 40 41 42 43 44 45 46 47 48 49 50 51 52 53 |
d3.json("../../_geodata/ken.topojson", function(json) { draw(json); }); function draw(json){ var projection = d3.geo .mercator() //投影法の指定 .scale(2000) //スケール(ズーム)の指定 .translate([500,450]) //表示位置調整 .center([139.0032936, 36.3219088]); //中心の座標を指定 var path = d3.geo.path().projection(projection); //パスジェネレーター var svg = d3.select("svg"); //マージさせるポリゴンのプロパティ。今回はObjName_1要素を使う var selected = d3.set([ "Gunma", "Saitama", "Nigata", "Tokyo", "Kanagawa" ]); //地形要素追加 svg.append("path") .datum(topojson.mesh(json, json.objects.ken, function(a, b) { return a == b; })) .attr({ "d": path, "fill": "#ccc" }); //境界要素追加 svg.append("path") .datum(topojson.mesh(json, json.objects.ken, function(a, b) { return a !== b; })) .attr({ "d": path, "fill": "none", "stroke": "#fff" }); //マージエリア追加 svg.append("path") .datum(topojson.merge(json, json.objects.ken.geometries.filter(function(d) { return selected.has(d.properties["ObjName_1"]); }))) .attr({ "d": path, "fill": "orange", "stroke": "none", }); } |
その他
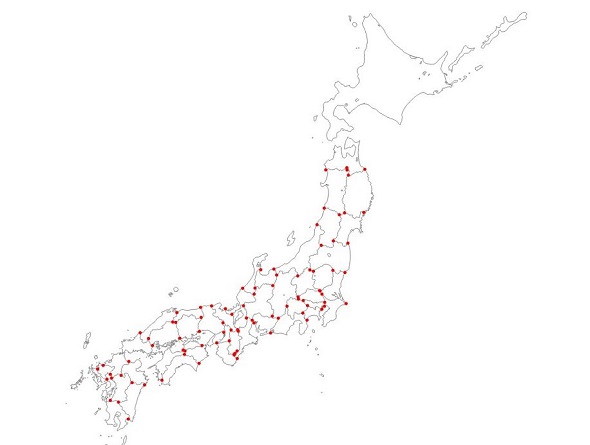
GeoJSONでは難しかった、交差ポイントの抽出などもTopoJSON形式のデータであれば比較的簡単に行えます。
|
1 2 3 4 5 6 7 8 9 10 11 12 13 14 15 16 17 18 19 20 21 22 23 24 25 26 27 28 29 30 31 32 33 34 35 36 37 38 39 40 41 42 43 44 45 46 47 48 49 50 51 52 53 54 55 56 57 58 |
d3.json("../../_geodata/ken.topojson", function(json) { draw(json); }); function draw(json){ var projection = d3.geo .mercator() //投影法の指定 .scale(2000) //スケール(ズーム)の指定 .translate([500,450]) //表示位置調整 .center([139.0032936, 36.3219088]); //中心の座標を指定 var path = d3.geo.path().projection(projection); //パスジェネレーター var svg = d3.select("svg"); //地形要素追加 svg.append("path") .datum(topojson.mesh(json)) .attr({ "d": path, "fill": "none", "stroke":"gray" }); var junctionByPoint = d3.map(); var arcCountsByPoint = d3.map(); json.arcs.forEach(function(arc) { var start = arc[0]; var startCount = arcCountsByPoint.get(start) || 0; var end = arc.reduce(function(p, v) { return [p[0] + v[0], p[1] + v[1]]; }); var endCount = arcCountsByPoint.get(end) || 0; if (arcCountsByPoint.set(start, startCount + 1) > 1) junctionByPoint.set(start, start); if (arcCountsByPoint.set(end, endCount + 1) > 1) junctionByPoint.set(end, end); }); svg.selectAll(".junction") .data(junctionByPoint.values()) .enter() .append("circle") .attr({ "class": "junction", "transform": function(d) { return "translate(" + transform(d) + ")"; }, "r":2.5, "fill": "red" }) function transform(point) { var p = projection([ point[0] * json.transform.scale[0] + json.transform.translate[0], point[1] * json.transform.scale[1] + json.transform.translate[1] ]); return p; } } |

